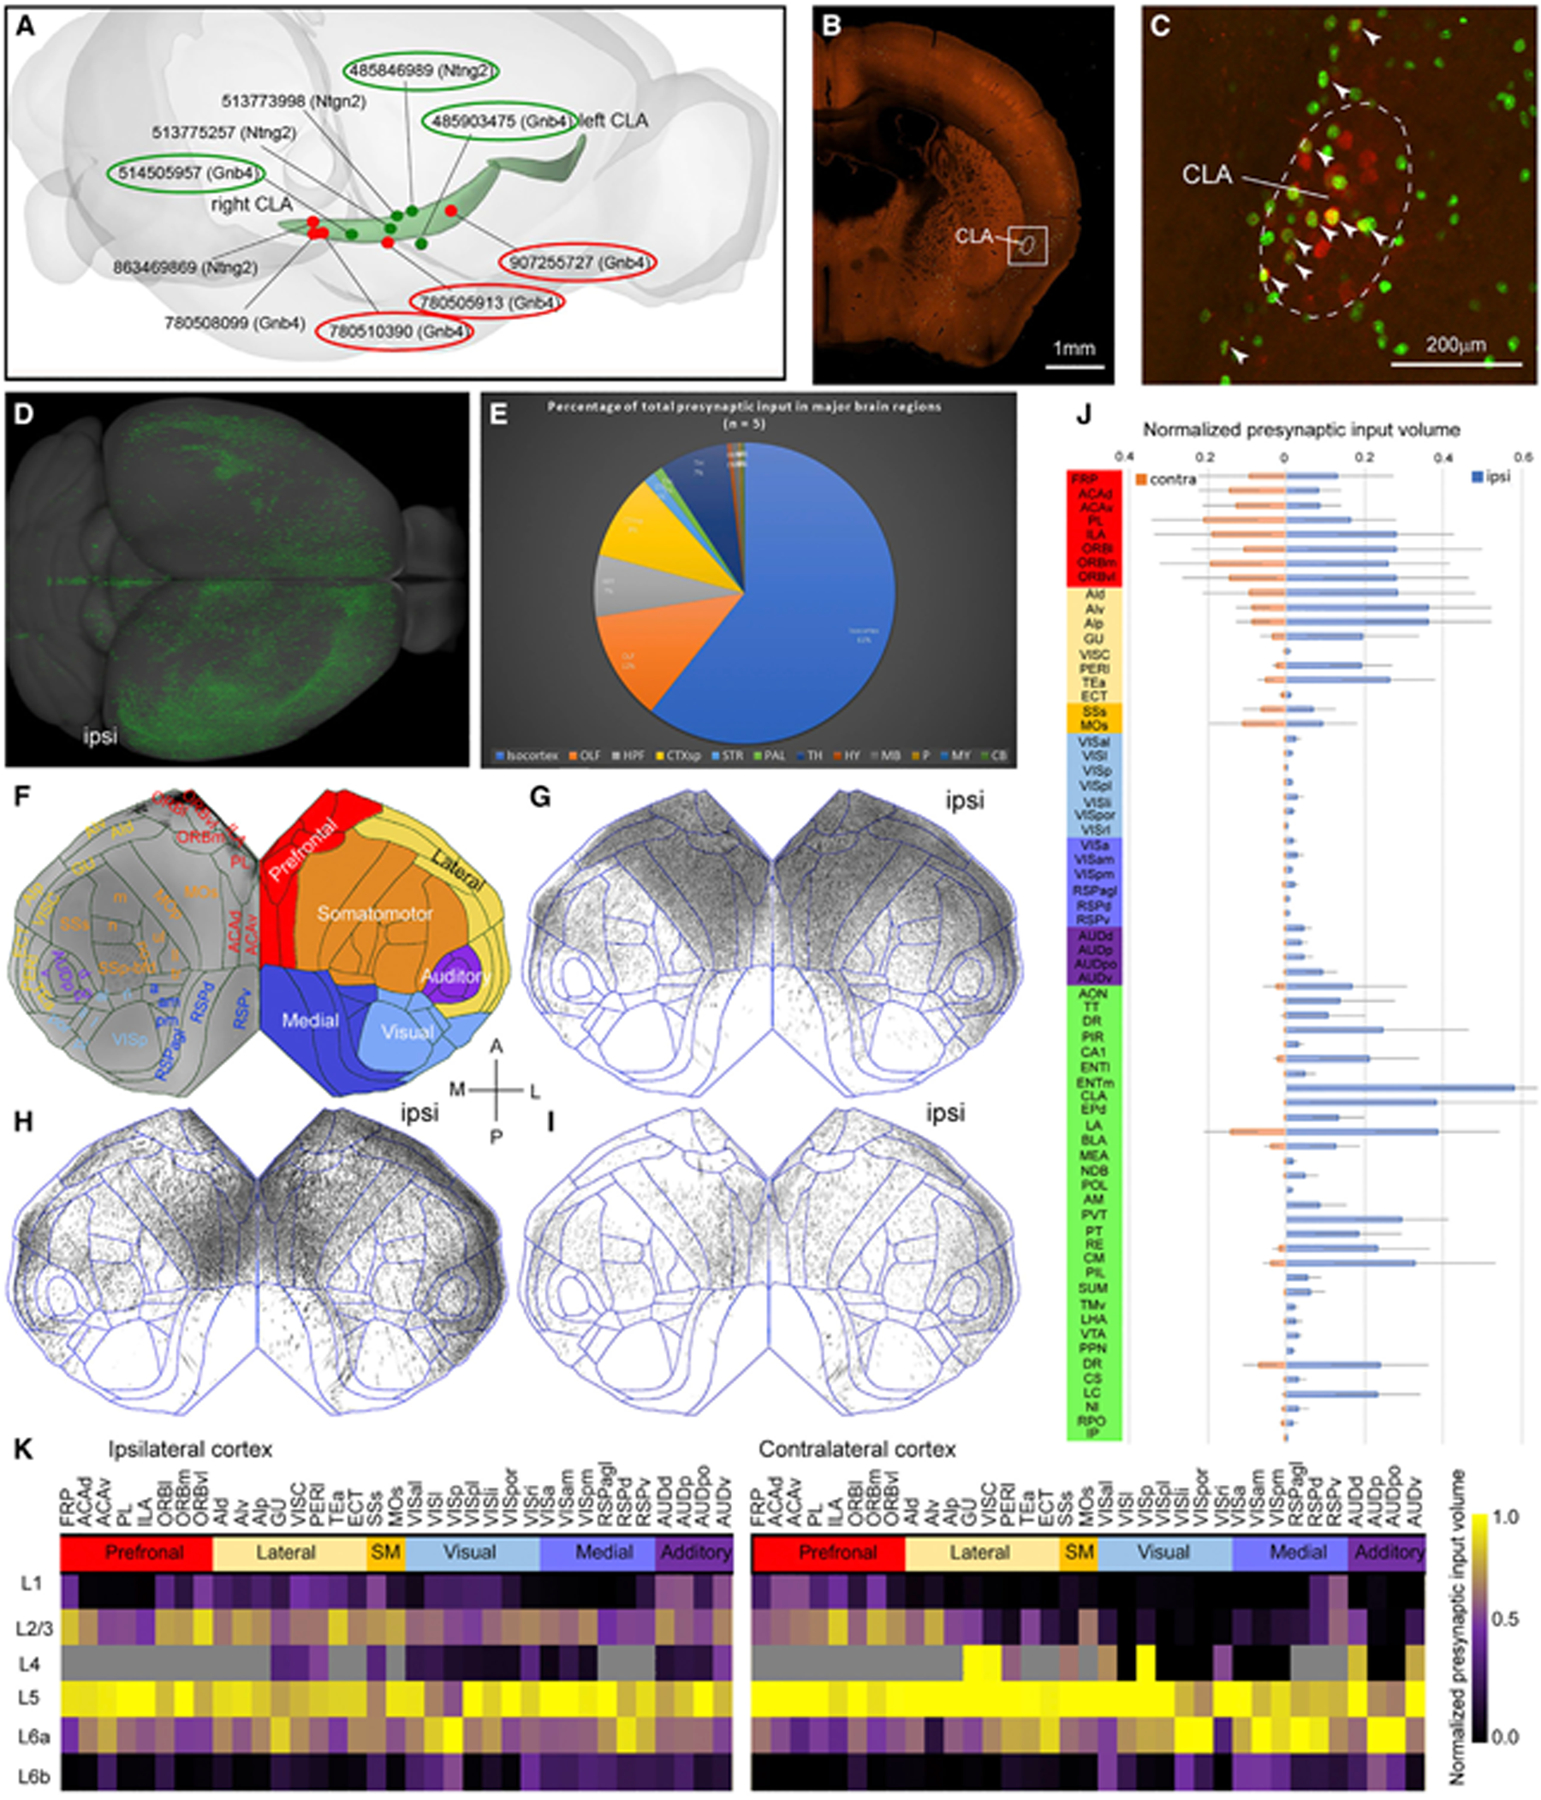
Figure 2. Whole-brain presynaptic inputs to the CLA revealed with retrograde rabies tracing.

(A) Red and dark green dots indicate Cre-dependent retrograde rabies and anterograde AAV injection sites, respectively. The curved light green objects represent CLA in the left and right hemispheres. The numbers are experiment IDs. The circled injections are shown as examples in (G)–(I) and Figure 5H–5J.
(B) One representative example of retrograde rabies injection sites in coronal view at low magnification. Scale bar, 1 mm.
(C) An enlargement of the boxed area in (B). Neurons were infected with the AAV helper virus (in red) and with rabies virus (in green). Arrowheads indicate starter cells (in yellow). The dashed line indicates the border of CLA. Scale bar, 200 μm.
(D) Presynaptic neurons (in green) to the CLA in the dorsal view. “Ipsi,” ipsilateral to the injection site (same in G–I).
(E) A fraction of whole-brain presynaptic input to the CLA from 12 major brain divisions (n = 5).
(F) Flatmap showing all isocortical areas on the left side and six cortical modules color-coded differently on the right. A, anterior; P, posterior; M, medial; L, lateral.
(G–I) Flatmaps reveal similar presynaptic labeling patterns across 3 CLA injections, arranged from anterior (G), middle (H), to posterior (I). Each black dot in the flatmap represents a presynaptic neuron.
(J) Bar graph showing a fraction of total presynaptic labeling for each of the brain structures normalized by starter cells and structural volume. Blue and pink bars represent presynaptic labeling in the ipsilateral and contralateral hemispheres, respectively. Data are represented as mean ± SD (n = 5).
(K) Quantitative analysis shows the laminar origin of cortical presynaptic neurons to the CLA (n = 5). Six cortical modules are color-coded differently. Cortical areas that do not have L4 in CCFv3 are color-coded in gray in the matrix. The color scale bar presents the range between 0 and 1.
