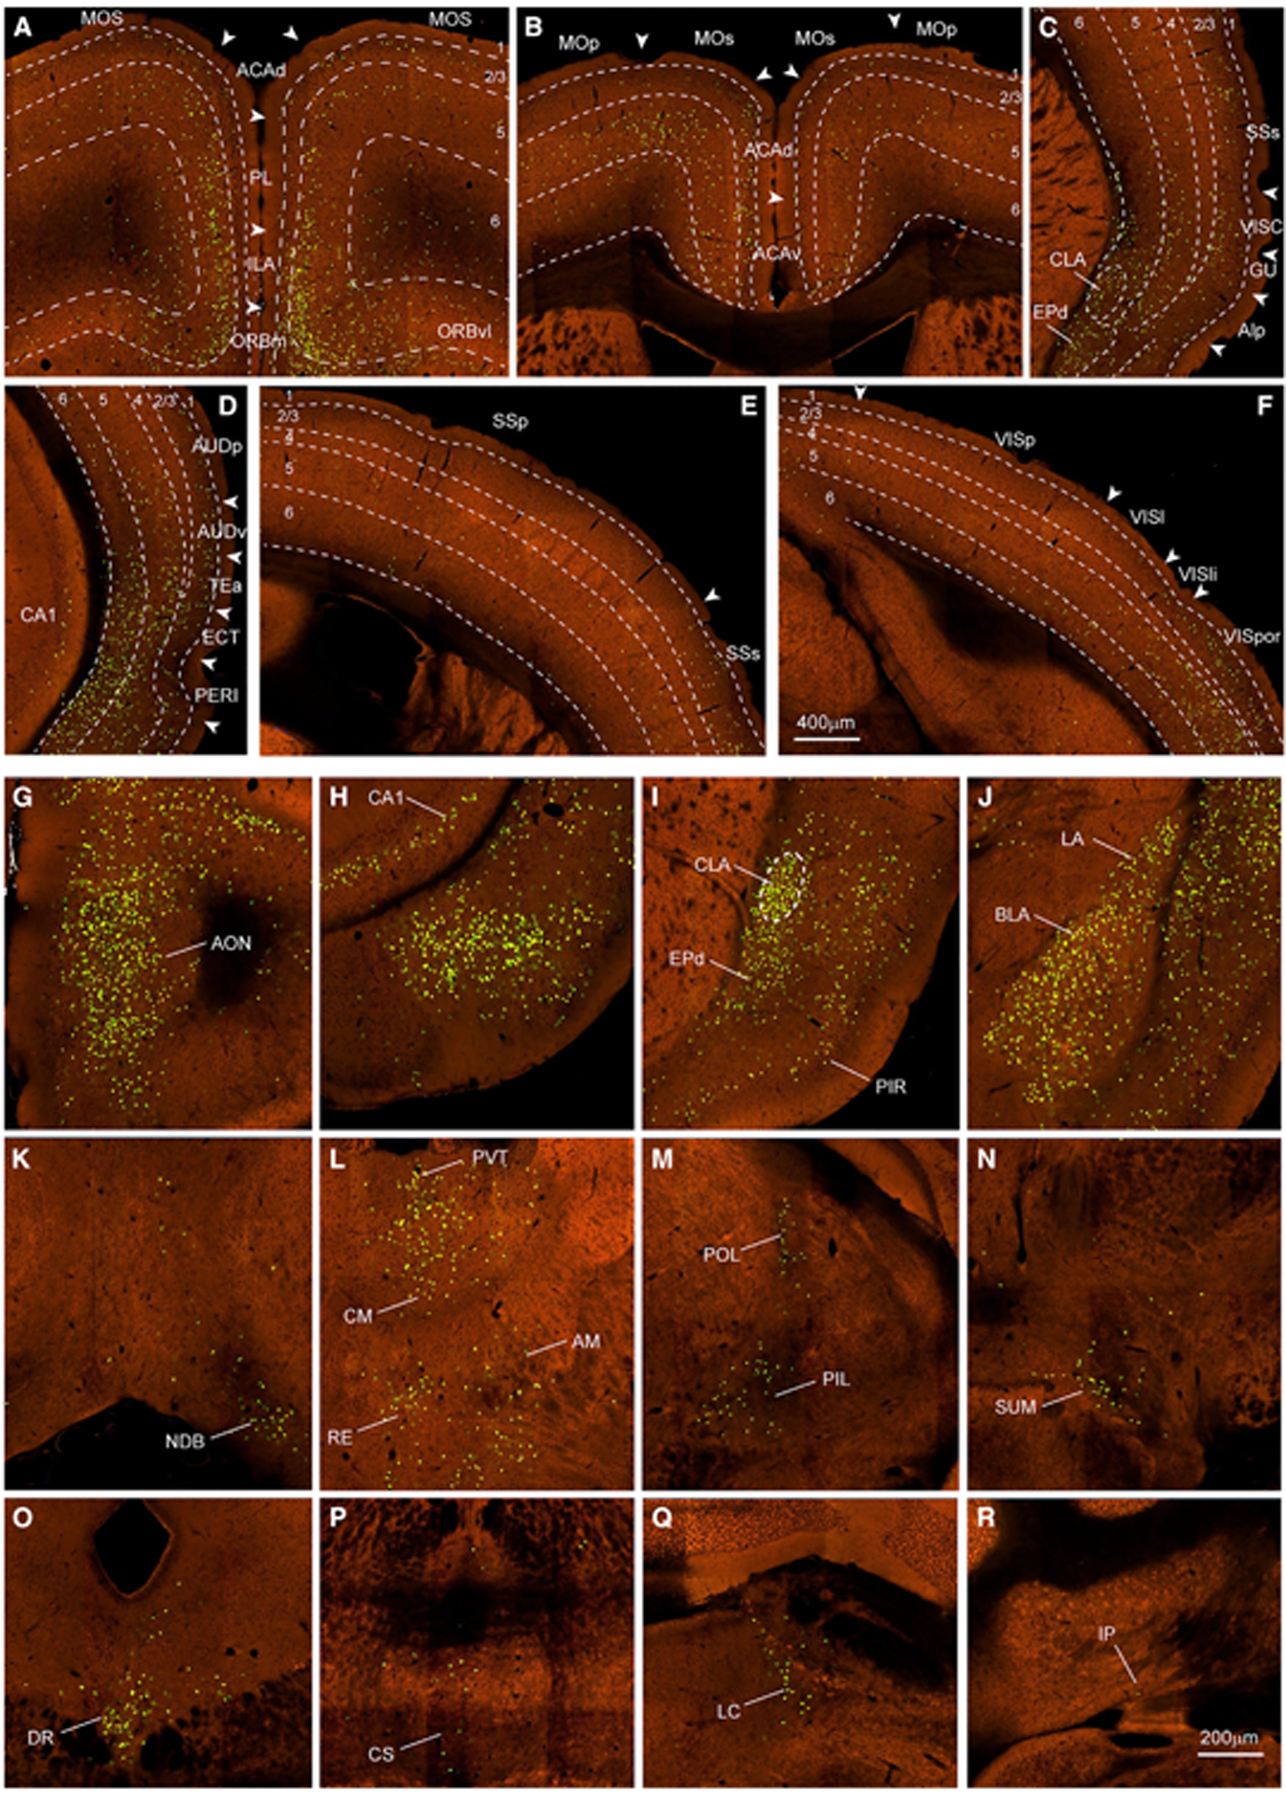
Figure 3. Cortical and subcortical presynaptic inputs to the CLA.

(A–F) Examples of presynaptic neurons in prefrontal (A and B), lateral (C and D), parietal (E), and occipital (F) cortices. Green dots are nuclear EGFP-labeled presynaptic neurons. Dashed lines indicate the borders of cortical layers and CLA. Arrowheads indicate the borders between cortical areas. Scale bar, 400 μm.
(G–R) Examples of presynaptic neurons labeled in other main brain regions outside isocortex are shown at high magnification, including AON (G) of the olfactory areas; ventral CA1 (H) of the hippocampal formation; CLA and EPd (I) and LA and BLA (J) of the cortical subplate; NDB (K) of the pallidum; PVT, CM, RE, and AM (L) and POL and PIL (M) of the thalamus; SUM (N) of the hypothalamus; DR (O) and CS (P) of the midbrain; LC (Q) of the pons; and IP (R) of the cerebellum. Scale bar, 200 μm.
For abbreviations, see Table S1.
