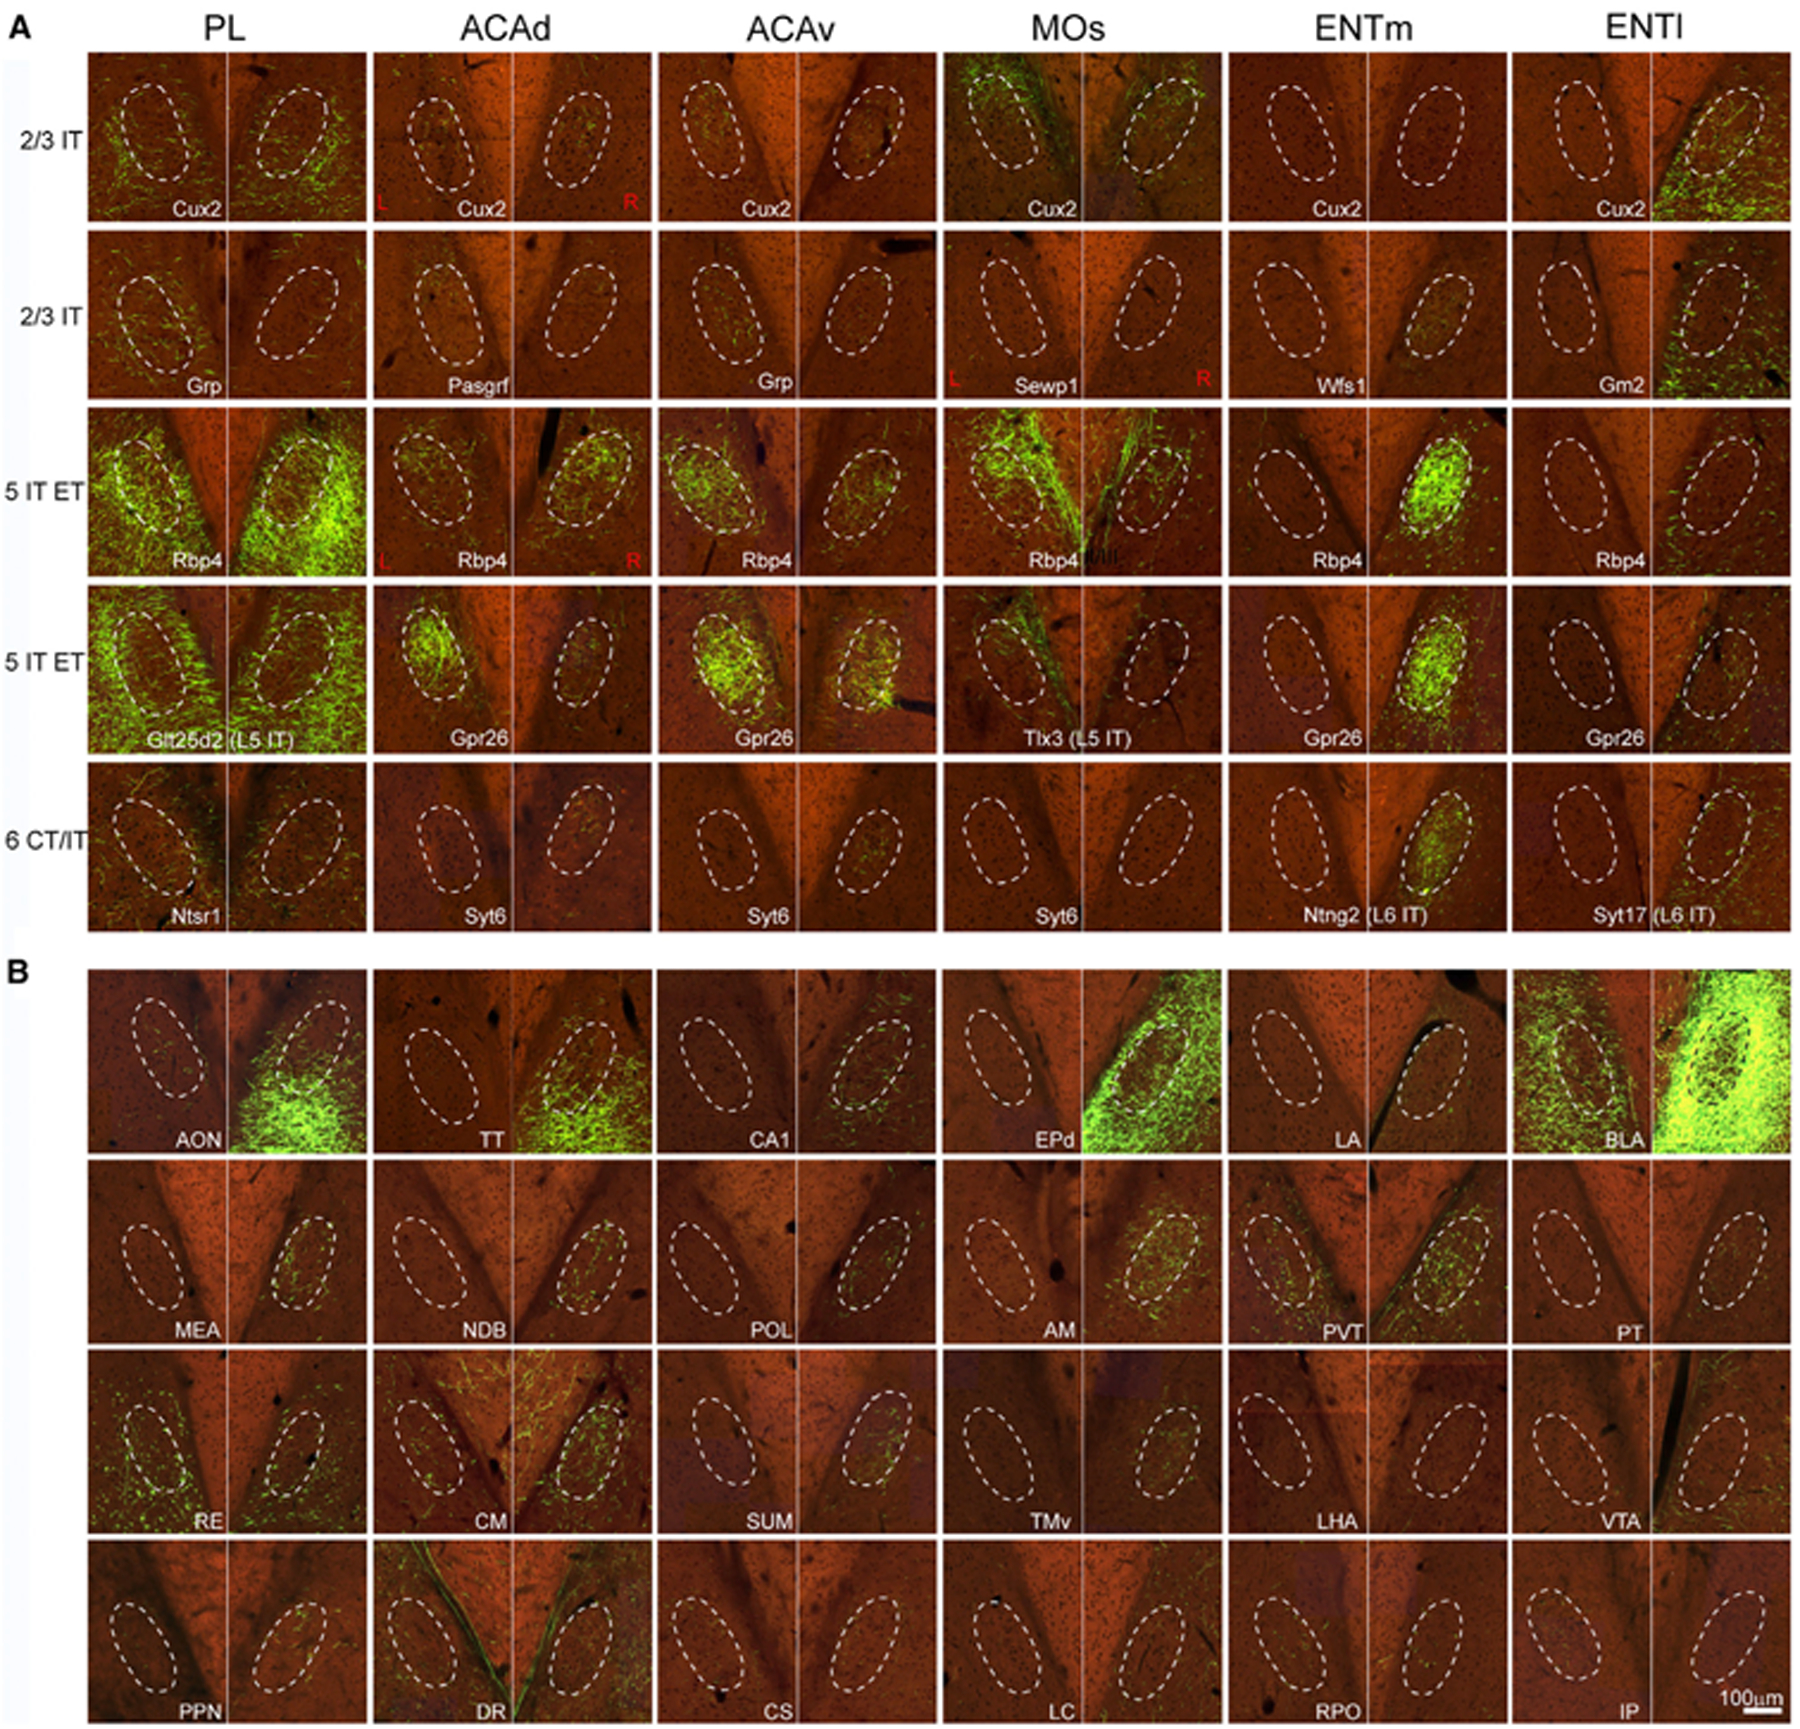
Figure 4. Anterograde AAV tracing reveals inputs to the CLA from cortex and subcortex.

(A) Examples showing axons in the CLA and its adjacent structures from injections into cell-type-specific transgenic lines for L2/3 IT, L5 IT, L5 IT ET, L6 IT, and L6 CT of cortical areas PL, ACAd, ACAv, MOs, ENTm, and ENTl. Dashed line represents the border of the CLA (same in B). Red L (left) and R (right) indicate injection sites on the left side of the brain and the rest of these injections are on the right side. Scale bar, 100 μm.
(B) Examples showing axons in the CLA and its adjacent structures with anterograde injections into 24 subcortical structures. Scale bar, 100 μm. For abbreviations, see Table S1. See also Figures S3 and S4 and Table S3.
