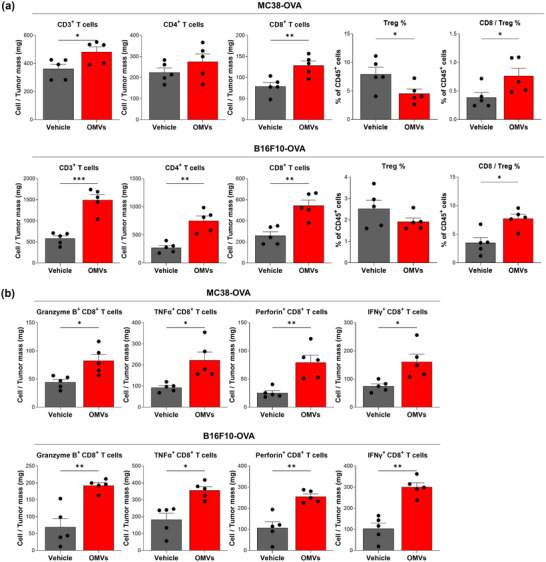
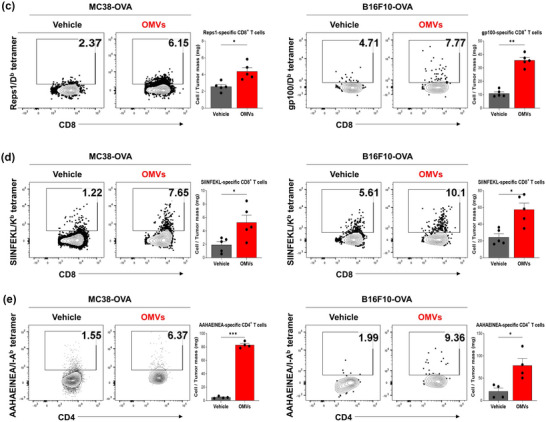
FIGURE 4.
Escherichia coli OMV‐induced recruitment and activation of cancer antigen‐specific T cell. C57BL/6 mice were subcutaneously inoculated with MC38‐OVA and B16F10‐OVA tumour cells. When the tumour volume reached about 100 mm3, 2.20 × 10¹⁰ of OMVs was intratumorally administered four times in 3 days interval. Mice were sacrificed 3 days post‐administration to analyze the immune profile of the tumour microenvironment via flow cytometry. (a) Flow cytometry analysis of tumour‐infiltrating T cell populations. Data are shown as frequency of CD3+, CD4+, and CD8+ T cells per milligram of tumour tissue, and as percentage of regulatory T cells from CD45+ T cells in tumour (n = 5). (b) Flow cytometry analysis of cytotoxic molecules expression on tumour‐infiltrating CD8+ T cell. Data are shown as frequency of Granzyme B+, TNFα+, Perforin+, and IFNγ+ CD8+ T cells per milligram of tumour tissue (n = 5). (c) Representative tetramer staining of Reps1‐specific CD8+ T cells and gp100‐specific CD8+ T cells. Reps1‐specific CD8+ T cells were analyzed using Reps1/Db tetramer and gp100‐specific CD8+ T cells were analyzed using gp100/Db tetramer. Data are shown as frequency of Reps1‐specific CD8+ T cells and gp100‐specific CD8+ T cells per milligram of tumour tissue (n = 5). (d, e) Representative tetramer staining of OVA‐specific CD8+ and CD4+ T cells. OVA‐specific CD8+ T cells were analyzed using SIIINFEKL/Kb tetramer and OVA‐specific CD4+ T cells were analyzed using AAHAEINEA/I‐Ab tetramer. Data are shown as frequency of OVA‐specific CD8+ (n = 5) and CD4+ T cells per milligram of tumour tissue (n = 4). *p < 0.05, **p < 0.01, ***p < 0.001 calculated by two‐tailed unpaired Student's t‐tests.