
FIGURE 6.
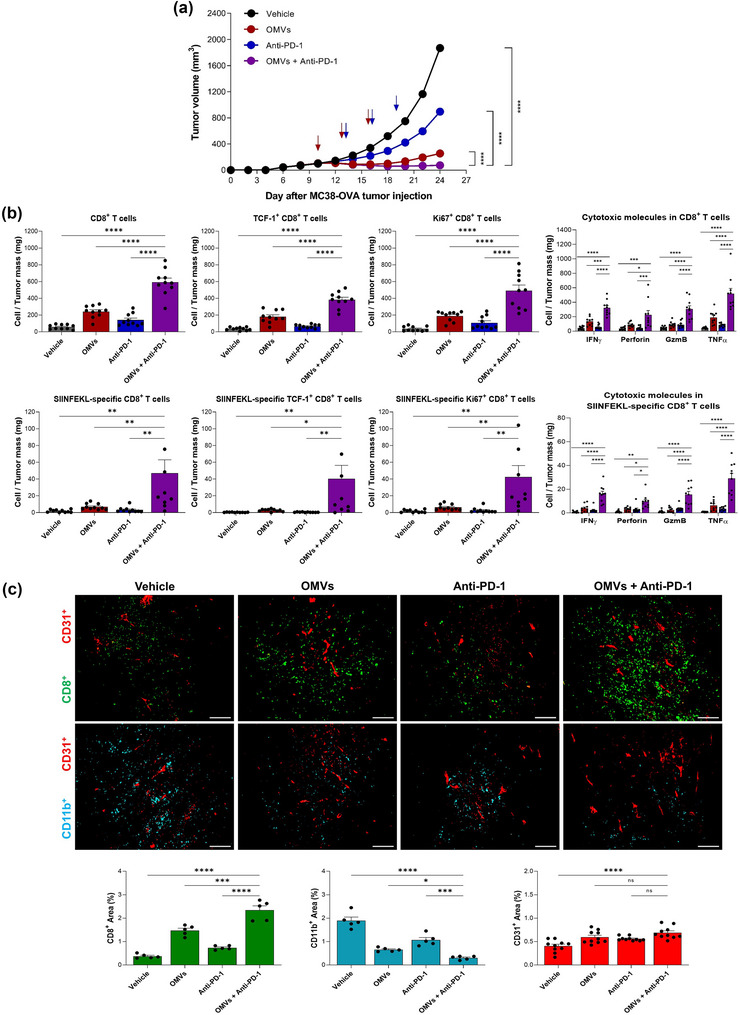
Synergistic anti‐tumour activity of Escherichia coli OMVs with anti‐PD‐1 immunotherapy. C57BL/6 mice were subcutaneously inoculated with MC38‐OVA cells. When the tumour volume reached about 100 mm3, mice were randomized into indicated groups. 2.20 × 10¹⁰ of OMVs was intratumorally administered three times in 3 days interval while 10 mg/kg anti‐PD‐1 antibody was intravenously administered three times in 3 days interval, 3 days after the first OMV administration. (a) Tumour volume was measured every 2 days. n = 22 for each group. (b) Flow cytometry analysis of total CD8+ T cell, TCF‐1+CD8+ T cell, Ki67+CD8+ T cell, and CD8+ T cells expressing cytotoxic molecules (IFNγ, Perforin, Granzyme B, TNFα); neoantigen‐specific CD8+ T cell, neoantigen‐specific TCF‐1+CD8+ T cell, neoantigen‐specific Ki67+CD8+ T cell, and neoantigen‐specific CD8+ T cells expressing cytotoxic molecules (IFNγ, Perforin, Granzyme B, TNFα). Data are shown as frequency of T cells per milligram of tumour tissue. GzmB, Granzyme B (n = 10). (c) Representative image of CD8+ T cells, CD11b+ myeloid cells, and CD31+ blood vessels in tumour tissue sections acquired via immunofluorescence (n = 5). Data are shown as percentage of leukocyte‐infiltrated area relative to the whole tumour, calculated using ImageJ software. n = 5 for each group. *p < 0.05, **p < 0.01, ***p < 0.001, ****p < 0.0001 calculated by two‐way ANOVA with Bonferroni correction for multiple comparisons.