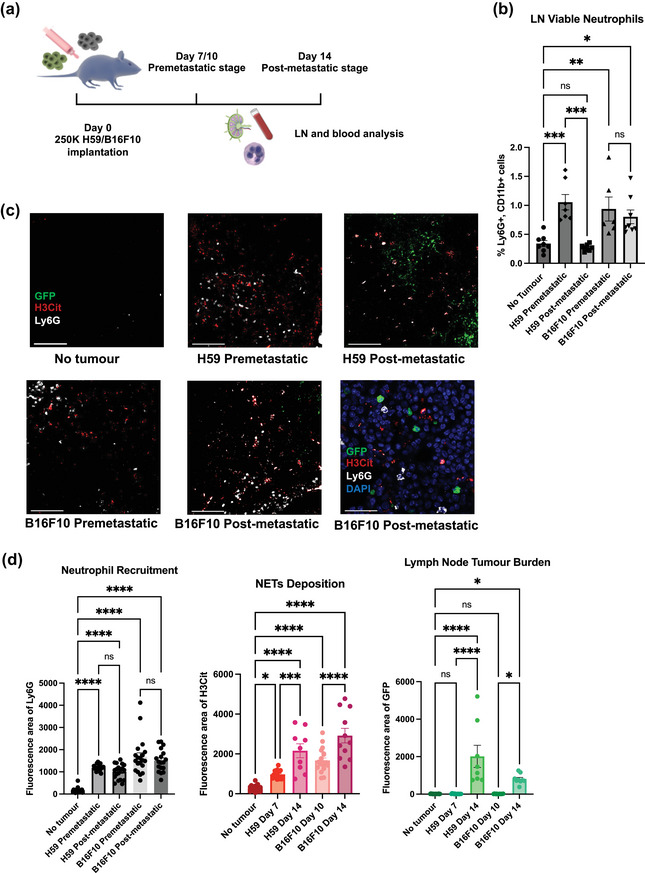
FIGURE 2.

The dynamic of LN neutrophil recruitment and NET deposition in mouse model. (a) Schematic illustration of the animal model construction. 250k H59 or B16F10 cells were injected into the flank of C57bl/6 mice (b) Percentage of LN viable neutrophils within all viable LN cells on a time course by flow cytometry. (c) Representative images of LNs on a time course for both H59 lung cancer and B16F10 melanoma. Scale bars represent 100μm. Zoomed NETs details are shown in bottom right. Scale bars represent 20 μm. (d) Quantification of the area of LN neutrophils (Ly6G), NETs (H3Cit) and tumour (GFP). Each data point is an image analysed, mouse n =10. Data shown as mean ± SEM. *, P < 0.05; **, P < 0.01; ***, P < 0.005; **** P < 0.001 by one‐way ANOVA.
