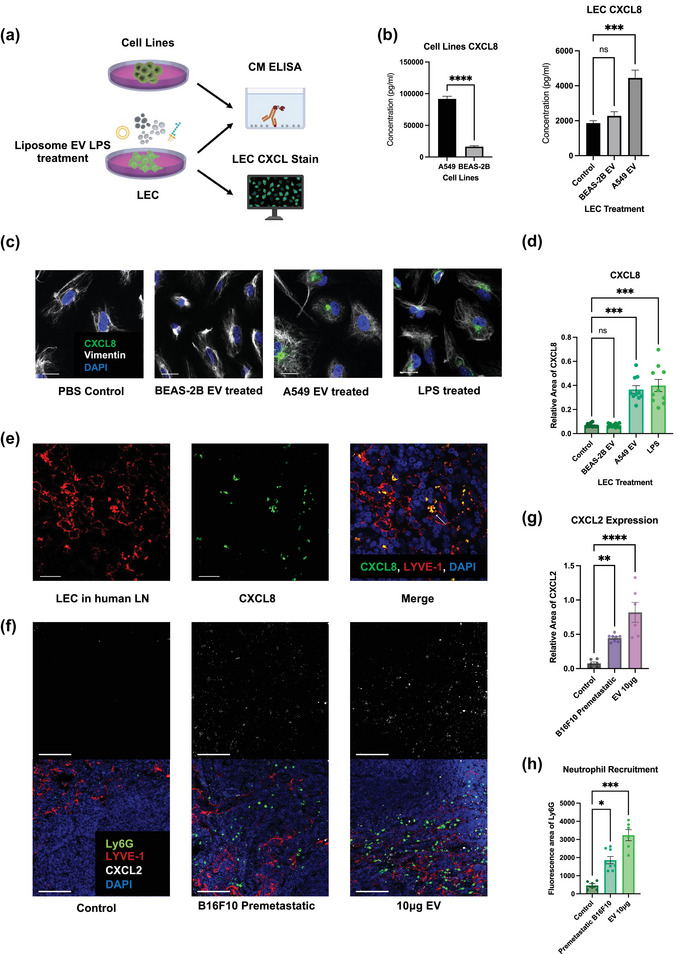
FIGURE 6.

LECs secrete neutrophil chemoattractants and NETs inducers upon EV uptake. (a) Schematic illustration of the ELISA and LEC CXCL8 stain. (b) ELISA of CXCL8 level in conditioned media (CM) of A549, BEAS‐2B and EV‐treated LECs. (c) Representative images of LECs expressing CXCL8 after different kinds of treatments. Scale bars represent 20μm. (d) Quantification of CXCL8 expression in LECs (relative fluorescence area of CXCL8 to DAPI). (e) Representative images of LECs expressing CXCL8 in tumour positive nodes of lung cancer patients. Scale bars represent 20μm. (f) Representative images of LECs expressing CXCL2 and recruiting neutrophils mouse LNs. Scale bars represent 100μm. (g) and (h) Quantification of CXCL2 expression (relative fluorescence area of CXCL2 to LYVE‐1) in LECs and neutrophil recruitment (Ly6G fluorescence area) in mouse LNs. Each data point is an image analysed, mouse n =10. Data shown as mean ± SEM. *, P < 0.05; **, P < 0.01; ***, P < 0.005; **** P < 0.001 by Mann–Whitney t test, One‐Way ANOVA or Kruskal–Wallis test.
