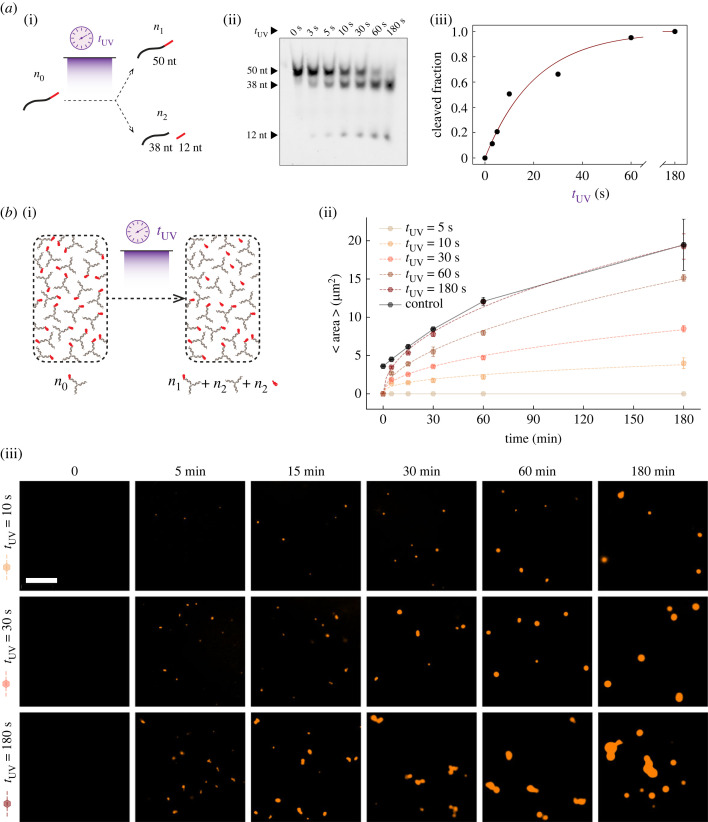
Figure 3.
Controlling condensate growth rate by dosing UV irradiation. (a) (i) Schematic illustration of the cleaved fraction (i.e. n2/n0) dependence of the modified strands on the exposure duration when they get exposed to the UV light. (ii) PAGE gel electrophoresis image, depicting the change in the population of cleaved and uncleaved strands in the solution with respect to the exposure duration. (iii) Plotting the cleaved fractions with respect to the exposure time (data points), as well as the exponential fitted curve (solid line) to the experimental data. (b) (i) A schematic summarizing our experiment in which we varied the UV exposure time to modulate the fraction of activated nanostars. (ii) Average area of the condensates over time, after UV irradiation of different duration (tUV of 5 s, 10 s, 30 s, 60 s and 180 s). The reference time (t = 0) on the horizontal axis is the moment the UV exposure starts. For the positive control (nanostars have no protector hairpin), t = 0 is the beginning of the incubation process right after annealing. The control sample is given by three-arm nanostars without the protector hairpin. Dots represent averages over three experimental replicates; error bars represent the standard deviation of the mean. All the experiments are done at a total nanostar concentration of 2.5 µM. Dashed lines correspond to the fitted curve based on our growth rate model (electronic supplementary material, §3.1). Solid lines simply connect the data points as a guide to the eye. (iii) Representative snapshots of the fluorescence microscopy images for three experiments (tUV = 10 s, 30 s and 180 s), taken at the incubation times of 0 min, 5 min, 15 min, 30 min, 60 min and 180 min. Scale bar: 15 µm.

