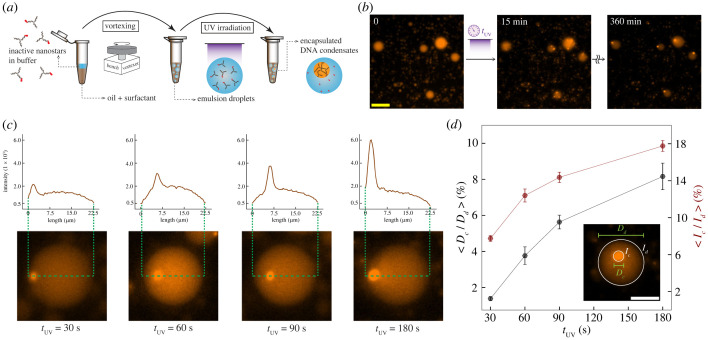
Figure 4.
Light-triggered formation of condensates of controllable size in synthetic protocells. (a) Schematic of the encapsulation process of DNA nanostars in w/o droplets. The oil–surfactant phase stabilizes the encapsulation after the vortexing step. After UV irradiation of the sample, condensation begins. (b) Representative fluorescence microscopy images of the photoactivated condensates within the w/o droplets, wherein the exposure duration is 180 s. Snapshots from left to right represent before exposure, 15 min and 360 min after exposure, respectively. Scale bar: 50 µm. (c) Intensity analysis of an example droplet image taken 6 h from UV irradiation, considering tUV equal to 30 s, 60 s, 90 s and 180 s, respectively, from left to right. The plots show the fluorescent intensity variation across the droplets, and clearly the peak intensity increases with longer irradiation time. Droplet images were rotated and aligned to facilitate comparison of the line intensities. (d) Normalized diameter and intensity of condensates in w/o droplets, plotted against the UV irradiation time. Intensity is integrated over the entire condensate or droplet. In each case, 12 droplets of similar size are chosen to be analysed, and each data point represents the value of the computed quantities averaged over all the droplets considered. The error bars represent the standard error. Scale bar: 15 µm.

