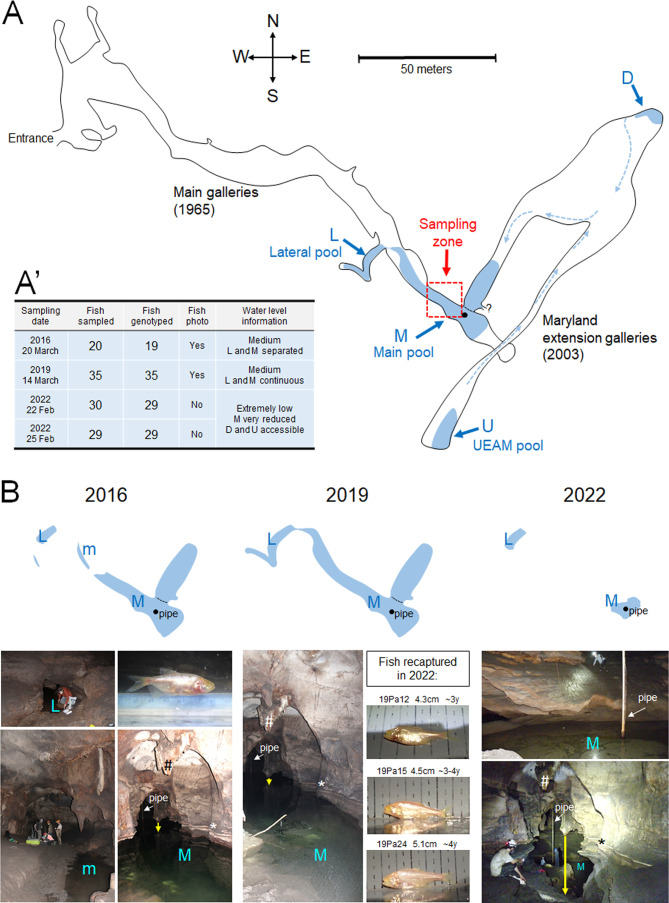
Figure 1.
Sampling for CMR in the El Pachón cave
A: Map of the Pachón cave (top view), adapted from the 2003 survey map drawing by Espinasa, Jeffery, and Yamamoto describing the Maryland extension galleries (in addition to the original galleries mapped in 1965 by Fish, Raines, Calvent, Evans, Alexander and Dunlap). Fish-containing pools are in blue, their names (and letter codes) are indicated. The back circle indicates the position of the pipe pumping water in the Main pool (M). The black dotted line indicates a rock arch that prevents human view and access (except through diving) to the part of the Main pool that leads towards the Maryland extension galleries. Circulation of the water flow from the Maryland extension into the Main pool is indicated by arrows. A’: A summary table of sampling numbers and dates, with hydrological conditions encountered. B: Illustration of the changing topography of the sampling site across years. Top panels show the sizes of the Lateral pool (L) and the Main pool (M) and their connectedness, depending on the water level (compare size and form of pools with the map above). Bottom panels show corresponding pictures. Blue letter codes identify the pools photographed. White arrows point to the pipe at the back of the Main pool. Labels * and # point to the same geological formation across photos for orientation and comparison. The yellow vertical arrows illustrate the dramatically low water level in the Main pool in 2022 as compared to 2016 and 2019. Photos of the 3 individuals sampled in 2019 that were re-captured in 2022 are shown. Their ages were estimated from their size according to Simon et al. (2017).

