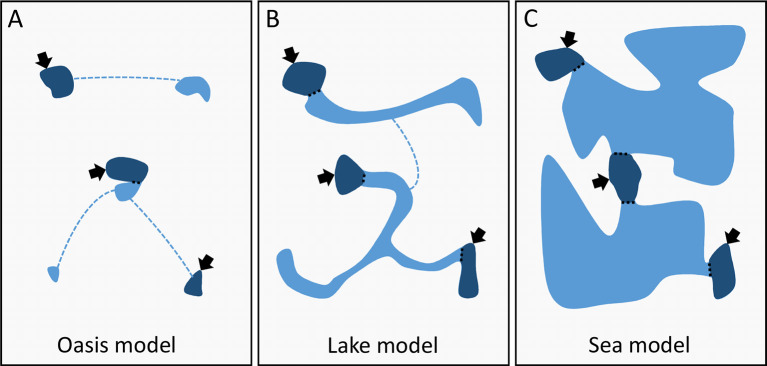
Figure 4.
Hypothetical models for the distribution of cavefish populations
Dark blue represents water bodies that are accessible to humans and where fishes can be observed and sampled (arrows). Light blue represents large or restricted, permanent or temporary water conducts and bodies that connect accessible pieces of water. The “Oasis” model corresponds to a patchy distribution of small populations with little connections (dashed lines). At the other end, the “Sea” model corresponds to a large population of cavefishes distributed over a large area in fully connected aquifers. The “Lake” model is an intermediate. See text for details.

