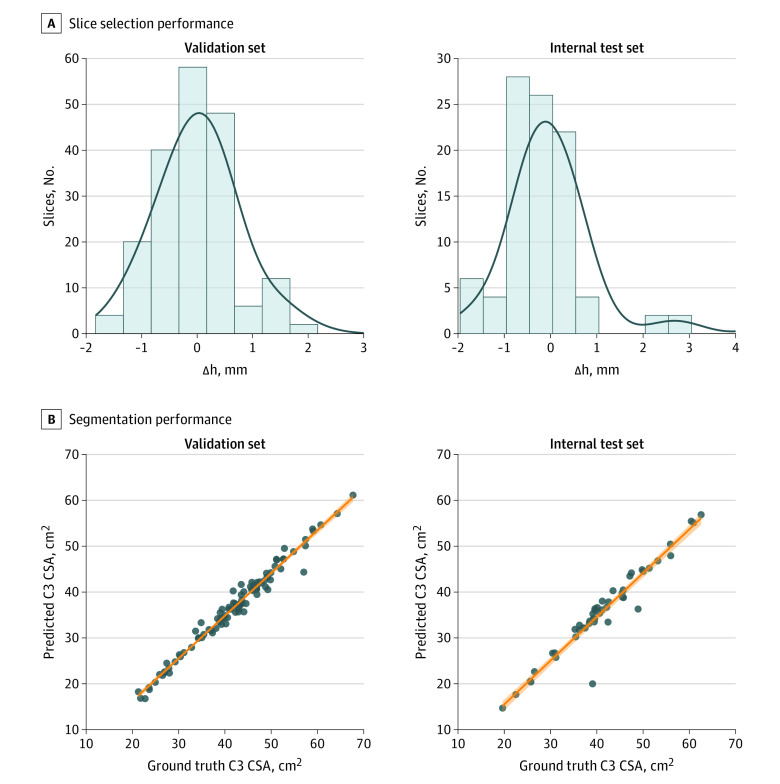
Figure 2. Performance of the Convolutional Neural Network Slice Selection Model and U-Net Segmentation Model for Segmentation of the C3 Vertebral Section.
A) Histogram shows the difference (Δh) between the location of the model-estimated C3 section slice and the location of the ground truth manually segmented computed tomography slice for the validation set (mean [SD] Δh, 0.11 [1.13] mm) and internal test set (mean [SD] Δh, 0.07 [1.08] mm). B) Scatterplots depict the C3 skeletal muscle cross-sectional area (CSA), with the ground truth manual segmentation on the x-axis and the calculated CSA using estimated segmentations on the y-axis for validation (r = 0.99; P < .001) and internal test (r = 0.96; P < .001) sets.

