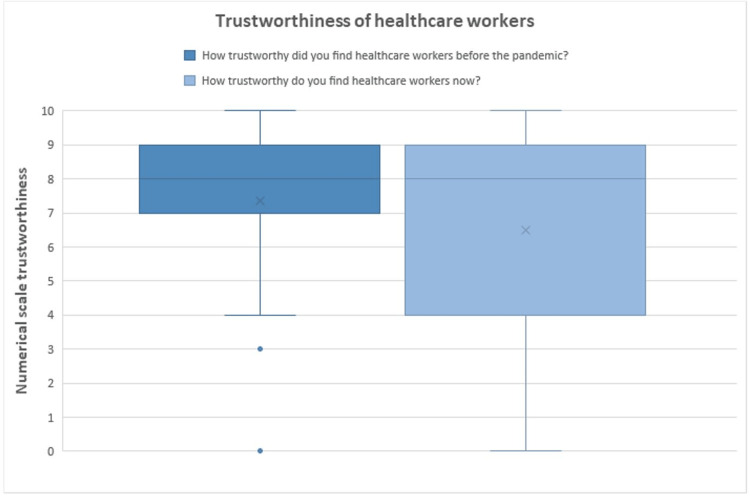
Figure 1. Trustworthiness of healthcare workers, before and after the pandemic.
Box and whisker plot showing quartiles. Before the pandemic: Min: 0, Max: 10, Median: 8, Mean 7.38 ± 1.95, 95% confidence interval 7.38 ± 0.35. After the pandemic: Min: 0, Max: 10, Median: 8, Mean 6.54 ± 2.92, 95% confidence interval 6.54 ± 0.52. The interquartile range (IQR) is defined as the distance between the 1st quartile and the 3rd quartile. The X on the graph represents the Mean.

