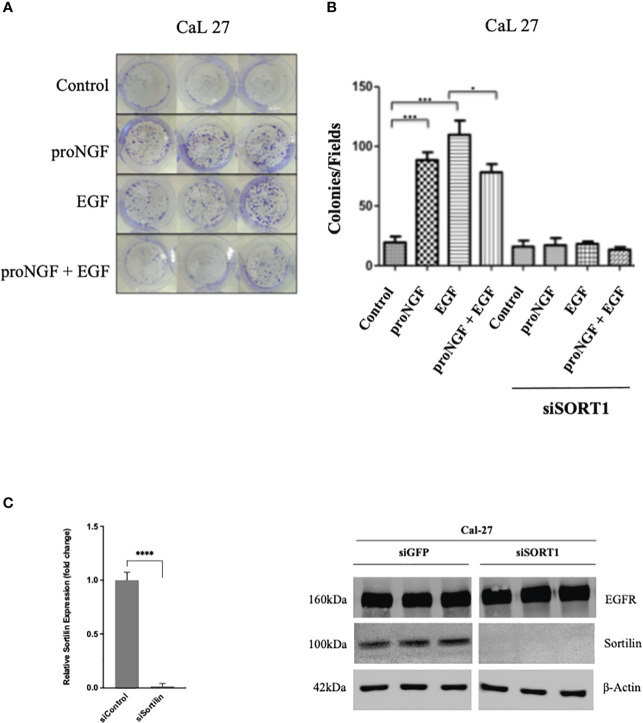
Figure 3.
Effects of EGF and proNGF on clonogenic cell growth of CAL 27 cells. (A) Example of CAL 27 colony forming units visualized by crystal violet staining. (B) Results are the average of 6 wells, based on the number of colonies visible to the naked eye per well. Comparison of means by non-parametric Mann-Whitney test (*p <0.05, **p <0.01, ***p <0.001). 2000 cells per well for Cal 27, 5000 cells per well for siSORT1. (C) Histogram representing the difference in relative expression of SORT1 after siSORT1 compared to siGFP, RTqPCR on Cal 27 cell line. Average expression of 3 samples. ****p<0.0001 (Student t-test). Western blot results on Cal 27 cell line after transient transfection with siRNA targeting the expression of SORT1 relative to a siGFP (sicontrol).

