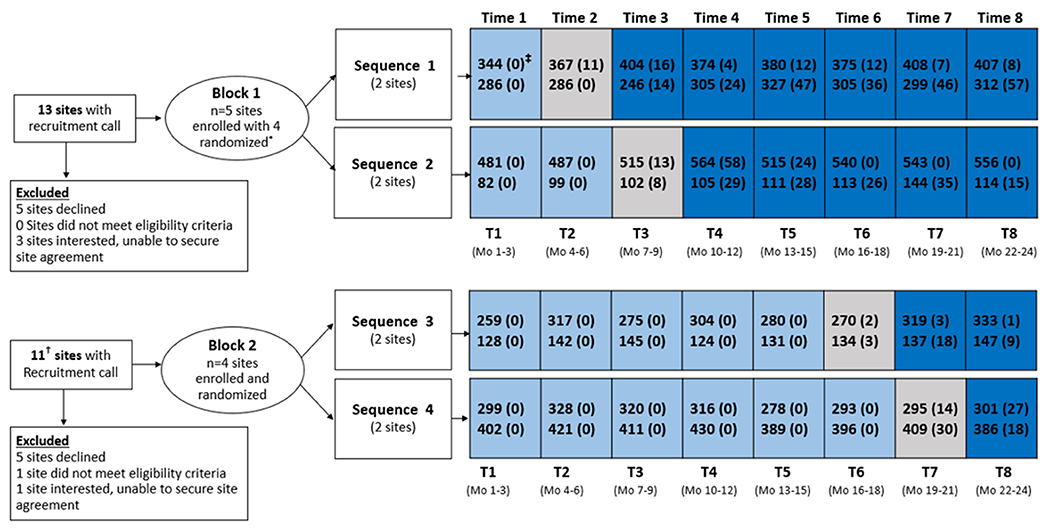
Figure 1. Study flow diagram.

Light blue indicates pre-STRIDE periods, gray indicates implementation period (STRIDE launch), dark blue indicates post-STRIDE periods.
* One of 4 randomized sites decided not to participate 2 months after randomization, citing inadequate staff capacity, and was replaced with an additional site that was able to follow the stepped wedge sequence
† Two of these sites also had a recruitment call in Block 1 (declined both times)
‡ Numbers within time interval represent the number of eligible hospitalizations; number of eligible hospitalizations with at least one STRIDE walk is presented in parentheses
