
Figure 11.
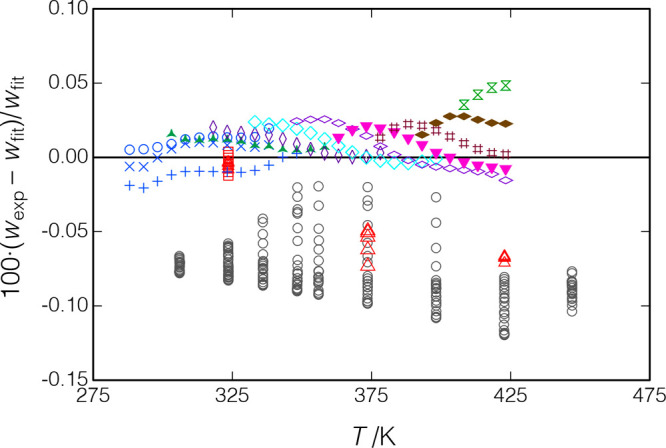
Deviations between the measured speed of sound for p-xylene and the fit of the present data (eq 14); ○, Al Ghafri et al.;30 Δ, □, present results for measurements along isotherms; replicates of the isochore starting at T = 288 K are indicated by ×, +, and ○ in blue (measured in that order); and other symbols indicate measurements along isochores.