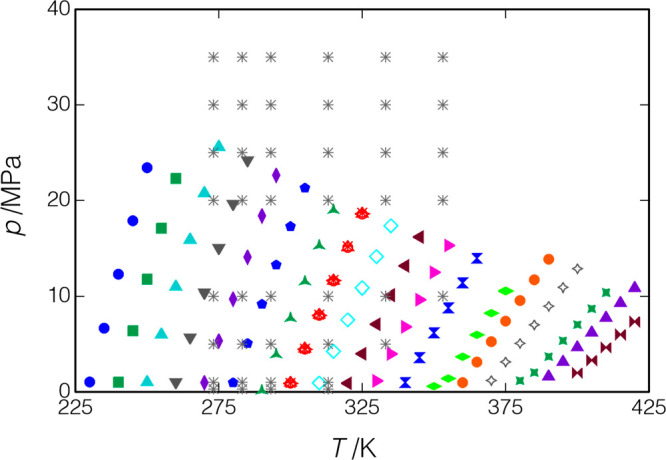
Figure 16.

Measured points for R1233zd(E) and *, data of Lago et al.19 Other symbols indicate the isochores measured in the present work. Replicates of the isochore starting at T = 300 K are indicated by × , + , ○, and Δ in red (measured in that order). The critical point of 438.86 K, 3.358 MPa is off the scale of the plot.
