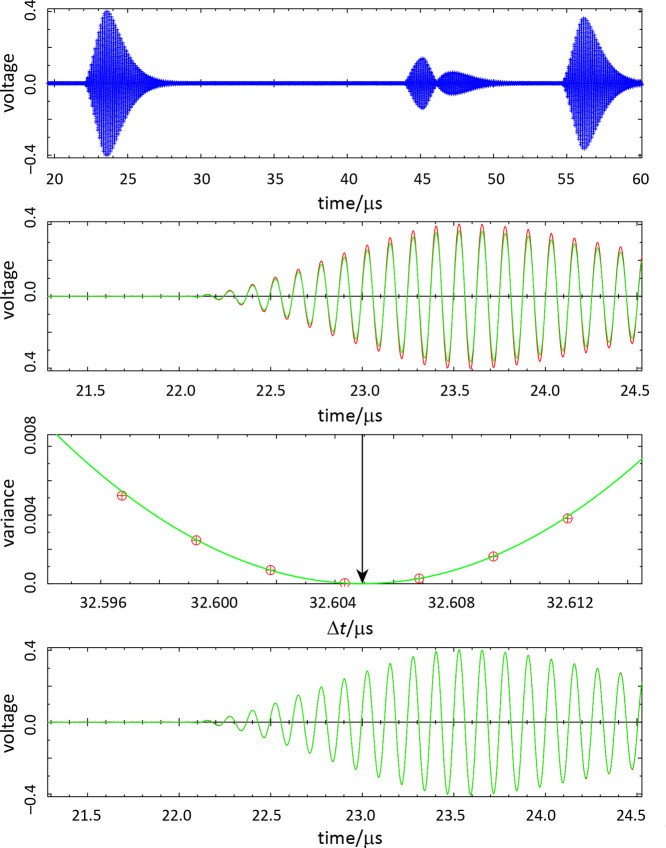
Figure 8.
Schema for the analysis of the echo data: (top) phase envelope for the 16 000 recorded data points; (second from top) approximate superposition of the short-path (red) and long-path (green) signals; (second from bottom) determination of the Δt giving the minimum variance for the superposition; and (bottom) final superposition. Data shown are for propane at T = 250.004 K, p = 6.403 MPa.

