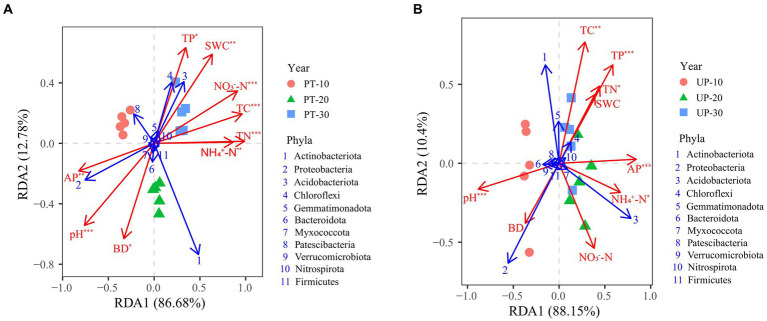
Figure 5.
Redundancy analyses (RDA) between soil environmental factors (red arrows) and bacterial community structure at the phylum level (relative abundance > 0.1%, blue arrows) of PT (A) and UP (B). Significant factors were identified by Monte Carlo permutation tests and are labeled as *p < 0.05, **p < 0.01, and ***p < 0.001.

