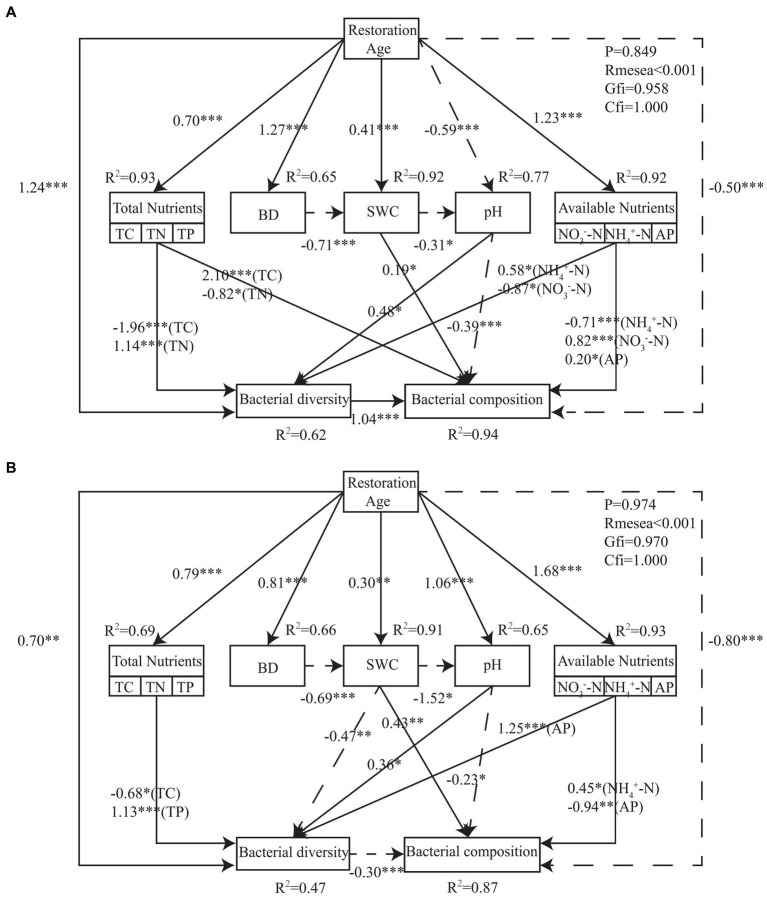
Figure 7.
Structural equation model describing the effects of restoration age, soil physical and chemical properties on bacterial community diversity and structure for PT (A) and UP (B). Solid lines indicate positive effects, and dashed lines indicate negative effects. Numbers on lines are standardized direct path coefficients. The significant paths are reported as follows: *p < 0.05; **p < 0.01; ***p < 0.001.

