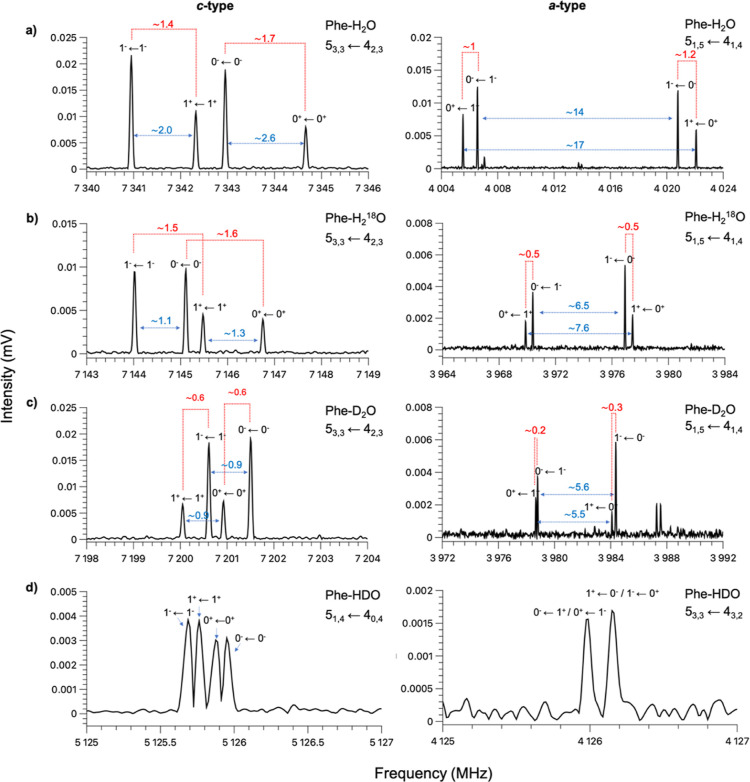
Figure 3.
Left: sections of the experimental spectra showing the c-type transition 53,3–42,3 of Phe–H2O (a), Phe–H218O (b), and Phe–D2O (c) and the c-type transition 51,4–40,4 of Phe–HDO (d). Right: sections of the experimental spectra showing the a-type transition 515–414 of Phe–H2O (a), Phe–H218O (b), and Phe–D2O (c) and the a-type transition 53,3–43,2 of Phe–HDO (d). Red dashed lines connect the two tunneling states generated by C2 internal rotation of the water molecule, while the blue arrows connect the two tunneling states arising from water’s translation motion. The two transitions are labeled following the notation JKa,Kc ← JK′a,K′c′. For each component of the tunneling splitting, the lower and upper tunneling states are indicated as 0+, 0–, 1+, and 1–. The magnitude of the splittings is given in megahertz.

