Figure 2.

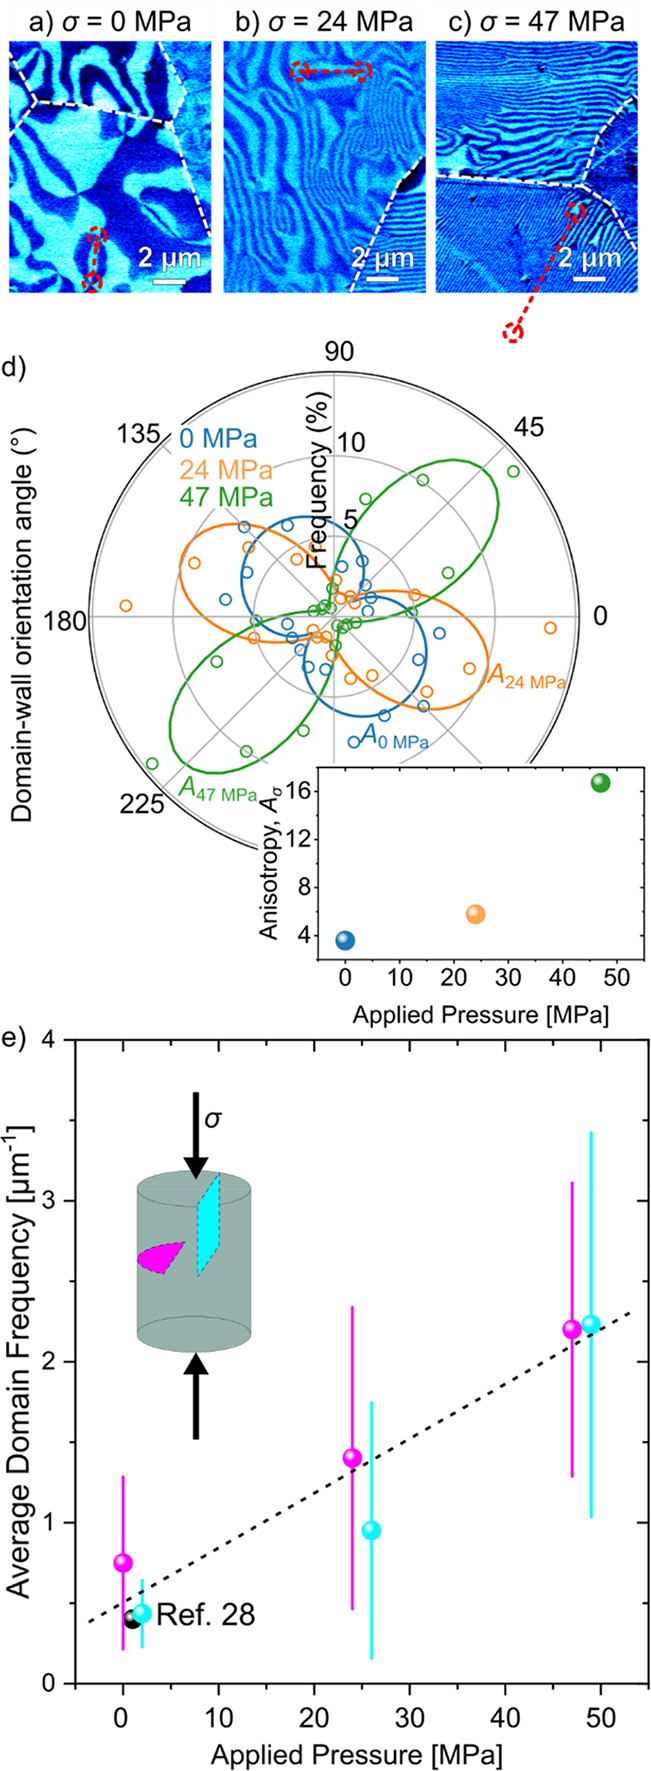
Control of the vortex density and domain frequency in polycrystalline ErMnO3 via mechanical pressure. Representative PFM images of polycrystalline ErMnO3 cooled under a) 0, b) 24, and c) 47 MPa. Overview images over an area of 50 × 50 μm2 of a section parallel and perpendicular to the mechanical pressure are displayed in Figure S4. Representative vortex/antivortex pairs are marked by dashed red circles in a) and b), whereas the respective antivortex core is outside the displayed area in c). A larger scanning area showing both the vortex and antivortex belonging to the pair is displayed in Figure S5. d) Relative distribution of the domain wall orientations displayed for different mechanical pressures for a representative grain. The orientation angle is measured relative to a reference line. The increasing degree of orientation of the stripe-like domains with increasing pressure is quantified by the anisotropy parameter Aσ, quantified in the inset (a derivation of Aσ is provided in Figure S6; calculated uncertainties are displayed in Table S1). The average frequency of stripe-like domains is displayed as a function of the applied mechanical pressure in e). Cyan and purple data points represent the cross-section parallel and perpendicular to the applied mechanical pressure. A literature value (black data point) of the average domain frequency of single crystalline counterparts cooled under the same cooling rate (5 K/min) is displayed for comparison.28 The dashed line represents a linear fit to the experimental data. The error bars correspond to the standard deviations of the experimental data. Complementary statistical information is provided in Figure S7.
