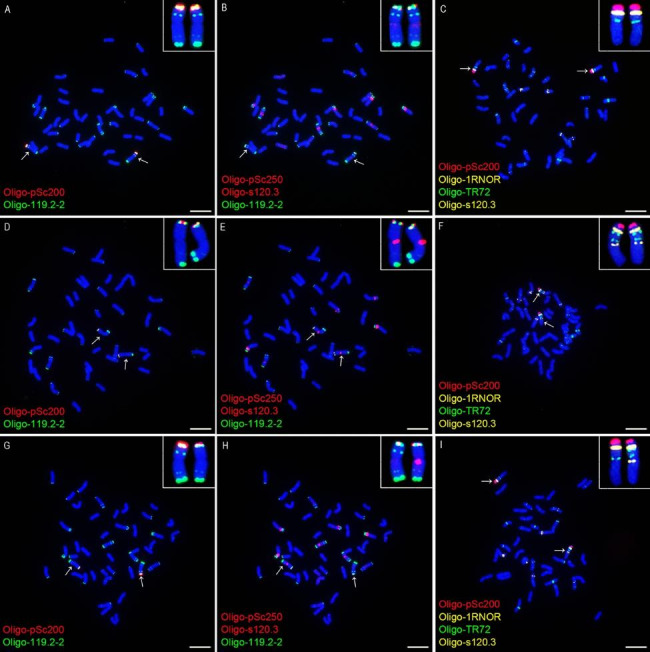
Fig. 2.

ND-FISH analysis of root-tip metaphase chromosomes of line 20T360-2, cultivar Zhou 8425B and the F1 plant representing the cross combination group 2. (A-C) The cells of Zhou 8425B. (A) and (B) are the same cells. (D-F) The cells of 20T360-2. (D) and (E) are the same cells. (G-I) The cells of a F1 plant from 20T360-2 × Zhou 8425B. (G) and (H) are the same cells. The probes Oligo-pSc200 (red), Oligo-pSc250 (red), Oligo-119.2-2 (green), Oligo-1RNOR (yellow), Oligo-TR72 (green) and Oligo-s120.3 (red or yellow) are marked in the figure. The arrows indicate the 1BL.1RS translocation chromosomes and the inserts indicate the enlarged ones. Chromosomes were counterstained with DAPI (blue). Scale bar: 10 μm
