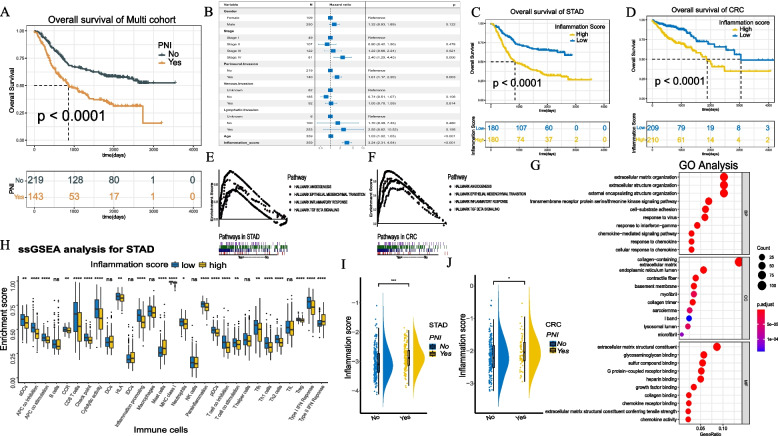
Fig. 1.
A Overall survival curves for of all GC patients in the training cohort. B Multivariate Cox regression analyses of significant prognostic factors. C, D Kaplan–Meier curves for the patients with high/low inflammation score in the training cohort and CRC cohort. E, F Gene Set Enrichment Analysis (GSEA) of high/low inflammation score groups in the training cohort and CRC cohort. G GO enrichment analysis of the significantly enriched biological processes between high and low inflammation score groups. H Derived ssGSEA scores of immune signatures obtained from STAD gene expression data for the groups of high and low inflammation score. I, J The comparing of Inflammation score between PNI and non-PNI groups in the training cohort and CRC cohort

