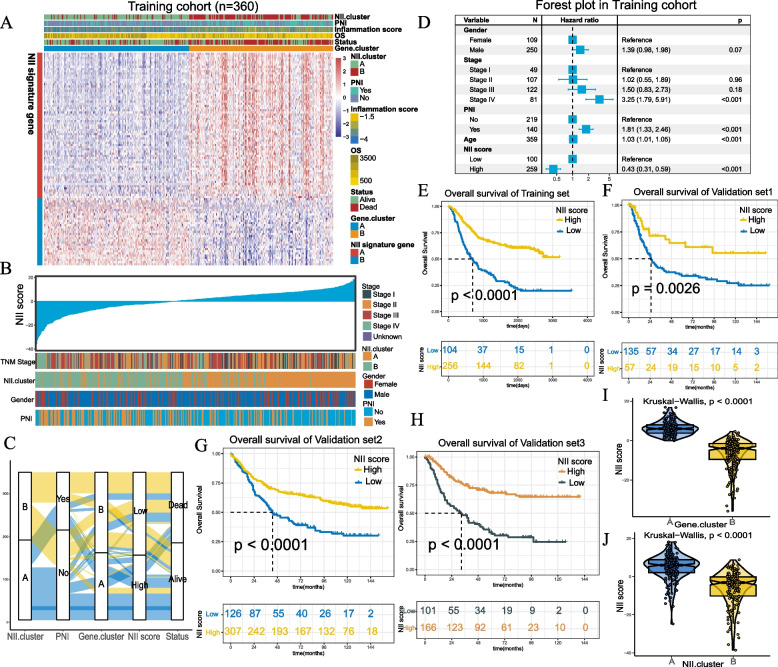
Fig. 7.
A Identification of NII score subgroups of STAD patients. B An overview of the association between known clinical and inflammation features (TNM stages, NII.clusters, gender and PNI) and NII score. Columns represent samples sorted by NII score from low to high (top row). Rows represent known clinical and inflammation features. C Alluvial diagram of NII.clusters in groups with different PNI groups, Gene.clusters, NII score, and survival status. D Forest plot displays the result of multivariate Cox regression analyses of significant prognostic factors. (Log rank test p < 0.001.) E–H Kaplan–Meier analyses demonstrate that patients with higher NII score exhibit worse prognosis in the training cohort (P < 0.0001), validation cohort 1 (P = 0.0026), validation cohort 2 (P < 0.0001) and validation cohort 3(P < 0.0001). I, J Relative distribution of NII score in groups with Gene.clusters and NII clusters. The thick line represents the median value. The bottom and top of the boxes are the 25th and 75th percentiles (interquartile range). The differences between groups were both compared through the Kruskal–Wallis test (p < 0.0001)

