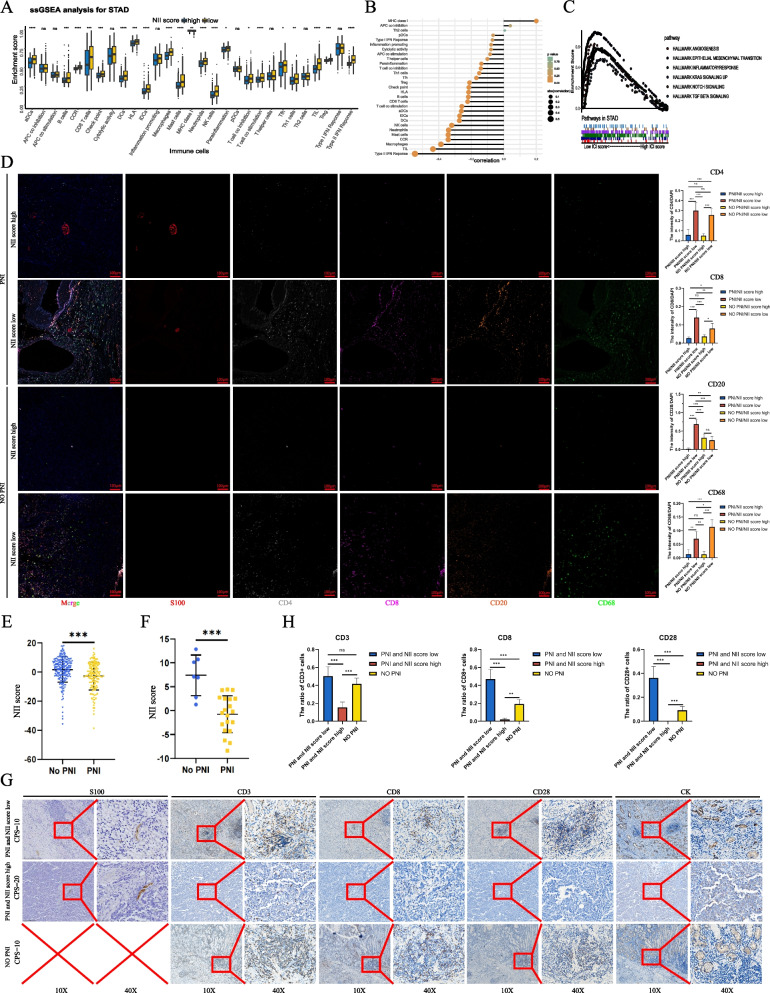
Fig. 8.
A Derived ssGSEA scores of immune signatures obtained from STAD gene expression data for the groups of high and low NII score. The range of P values were labeled above each boxplot with asterisks.(ns P > 0.05, *P < 0.05, **P < 0.01, ***P < 0.001, ****P < 0.0001) B The correlation of immune cells and NII score in the training cohort. The range of P values are represented by color from yellow to green. C The significantly enriched signal pathways from Gene Set Enrichment Analysis (GSEA) performed between the subgroups of high and low NII score in the Multi cohort. D The representative results of multiple immunofluorescence staining of subgroups(PNI with high NII score,PNI with low NII score,non-PNI with high NII score and non-PNI with low NII score).(S100 in red,CD68 in green,CD20 in orange,CD8 in purple,CD4 in white and DAPI in blue.The statistical results were performed in 5 random views of per group under 40X. *P < 0.05; **P < 0.01; ***P < 0.001) E, F The comparing between PNI and non-PNI patients in training cohort and Nanfang cohort 2. G The representative figures of IHC analyse of subgroups(PNI with high NII score, PNI with low NII score and non-PNI patients, CPS scores were obtained from clinical pathological report) accepting anti-PD1 treatment. (S100,CD3,CD8,CD28 and CK were stained with DAB in brown,nucleus were stained with hematoxylin in purple) (H)The statistical result of CD3,CD8 and CD28 were performed in 5 random views of per group under 40X.(*P < 0.05; **P < 0.01; ***P < 0.001)

