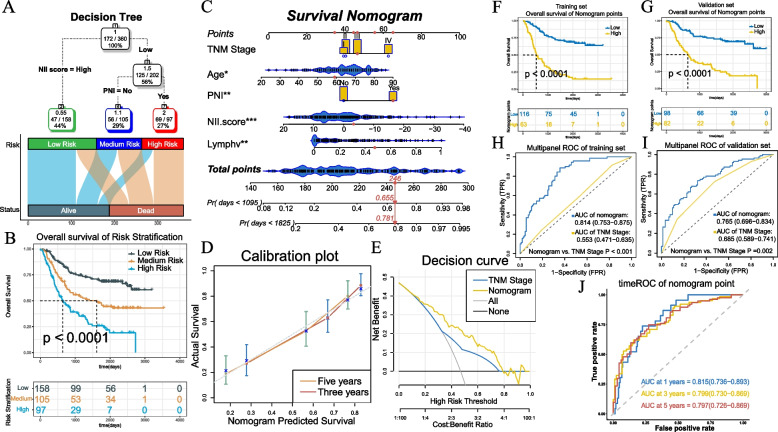
Fig. 9.
A A survival decision tree built to optimize the prognostic stratification combined with a alluvial diagram of risk stratification and survival status. B Significant differences of overall survival (OS) are observed among the three risk subgroups (P < 0.0001). C A personalized scoring nomogram is generated to predict 3- and 5-year OS probability with five parameters( TNM Stage, Age, PNI, Lymphv and NII score), and the arrow shows an example. D Calibration curves of 3-year and 5-year overall survival (OS) prediction are close to the ideal performance (45-degree line). E Decision curve demonstrates that the nomogram exhibited more powerful capacity of survival prediction compared with TNM stage system. F-G Kaplan–Meier curves for the patients with high and low overall survival of Nomogram points in the training cohort (Log rank test, p < 0.0001.) and validation cohort (Log rank test, p < 0.0001.). H-I The comparing between nomogram and TNM system with ROC in training cohort and validation cohort. J Time-dependent ROC curves of nomogram in training cohort

