Figure 3.
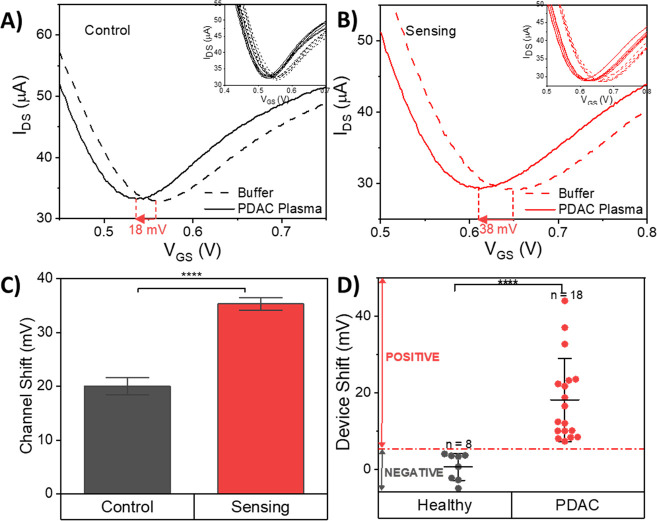
Clinical detection of PDAC cancer exosomes in PDAC patient and healthy control plasma using the GFET biosensor. (A) Representative IDS–VGS curve of one of the control channels on the GFET biosensor before and after PDAC plasma incubation. The inset image shows the response from 6 control channels on the GFET biosensor. (B) Representative IDS–VGS curve of one of the sensing channels on the GFET biosensor before and after PDAC plasma incubation, showing a significant curve shift in the sensing channel. The inset image shows the response of 6 sensing channels on the GFET biosensor. (C) Device shift of the 6 control and 6 sensing channels on a representative clinically tested GFET device. The device shift arising from a plasma sample is calculated based on the difference between the GFET response from control and sensing channels. (D) Measurement results for the GFET biosensor from the clinical testing with plasma samples from 18 PDAC patients and 8 healthy controls, indicating a clear threshold detection signal line, which suggests that the sensor is able to differentiate PDAC patients from healthy controls (****P< 0.0001). Data are mean ± standard deviation (s.d.).

