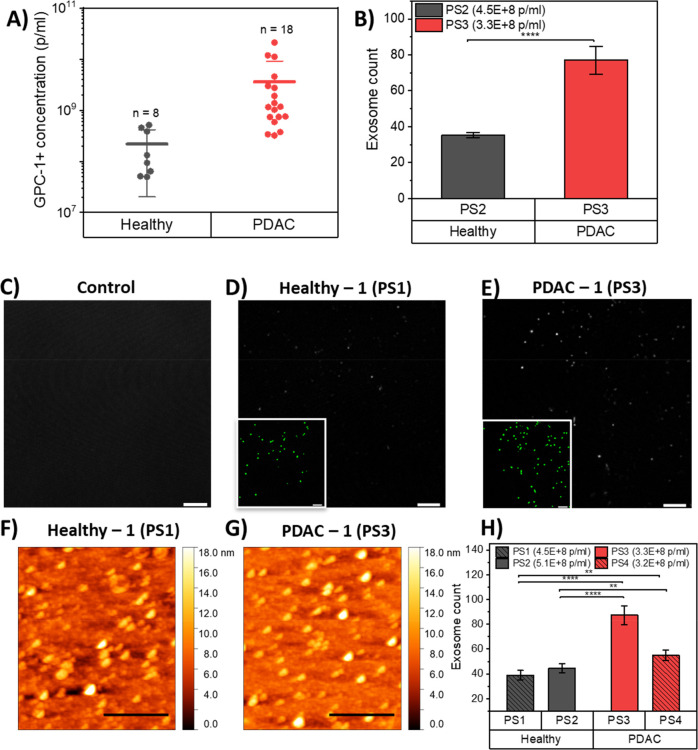
Figure 4.
Validation of the detection of PDAC cancer exosomes in PDAC patient and healthy control plasma. (A) Concentrations of GPC-1+ exosomes detected in 18 PDAC patient plasma samples and 8 healthy control plasma samples by Nano Flow cytometry measurements. Comparison of the numbers of PDAC and healthy exosomes captured on GFET biosensors. (B) Fluorescence confocal microscopy images of exosome count on GFET sensors taken from an average of three positions on the functionalized graphene surface incubated with PDAC plasma sample and three positions incubated with healthy plasma sample. (For details of the method used to count exosomes, see the Materials and Methods). (****P < 0.0001). (C) Functionalized graphene surface with no exosome as control. (D) Functionalized graphene surface incubated with healthy plasma sample (PS1). (E) Functionalized graphene surface incubated with PDAC plasma sample (PS3). Exosome signal is shown in gray scale, and the inset shows the same field of view with the detected exosomes after bioimage analysis in green to make it clearer. Confocal scale bars = 5 μm. (F) Atomic force microscopy images of functionalized graphene surface incubated with healthy plasma sample (PS1). (G) AFM images of functionalized graphene surface incubated with PDAC plasma sample (PS3). (H) Exosome count on GFET sensors taken from an average of eight spots on each of the functionalized graphene surfaces incubated with healthy plasma samples (PS1 and PS2) and eight spots on incubated with PDAC plasma samples (PS3 and PS4). (**P < 0.01, ****P < 0.0001). AFM scale bars = 1 μm. Data are mean ± s.d.

