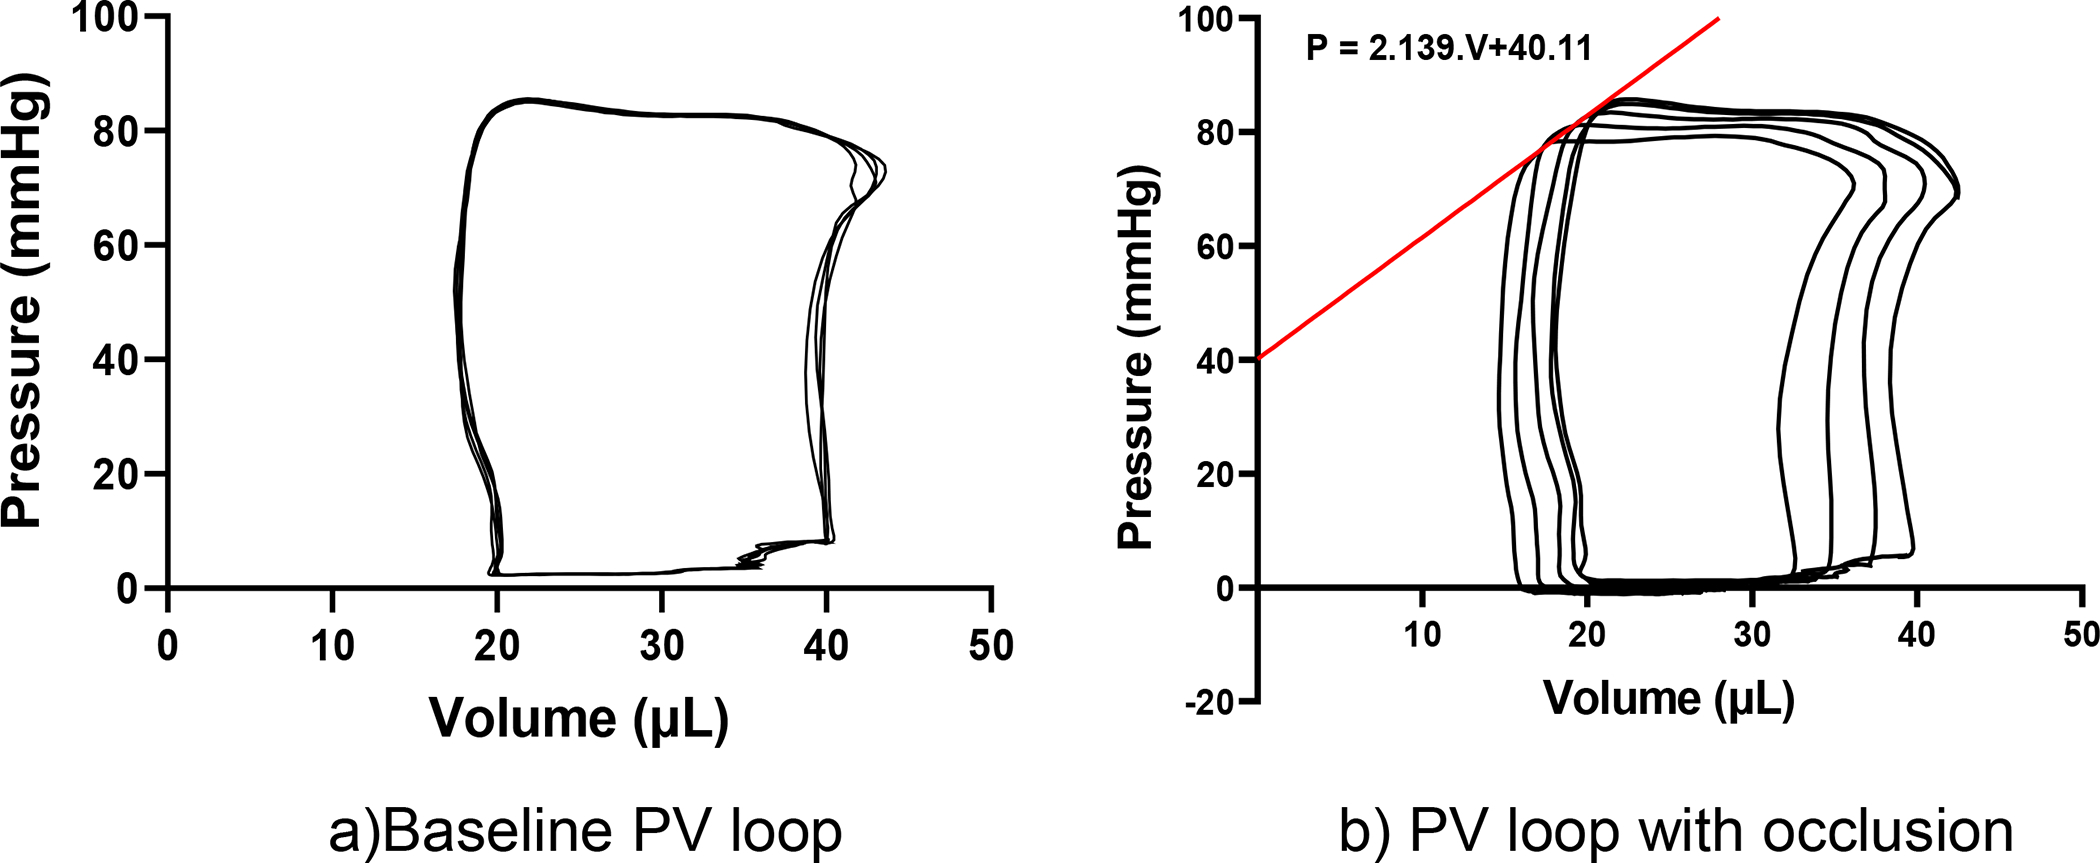
Fig. 3.

(A) Representative P-V loops from baseline left heart catheterization. (B) representative P-V loops during inferior vena cava occlusion, the red line indicates the end-systolic pressure-volume relationship (ESPVR). The organ-level contractility, measured by end-systolic elastance (E es), from the slope of the representative ESPVR line was 2139 mmHg/ml.
