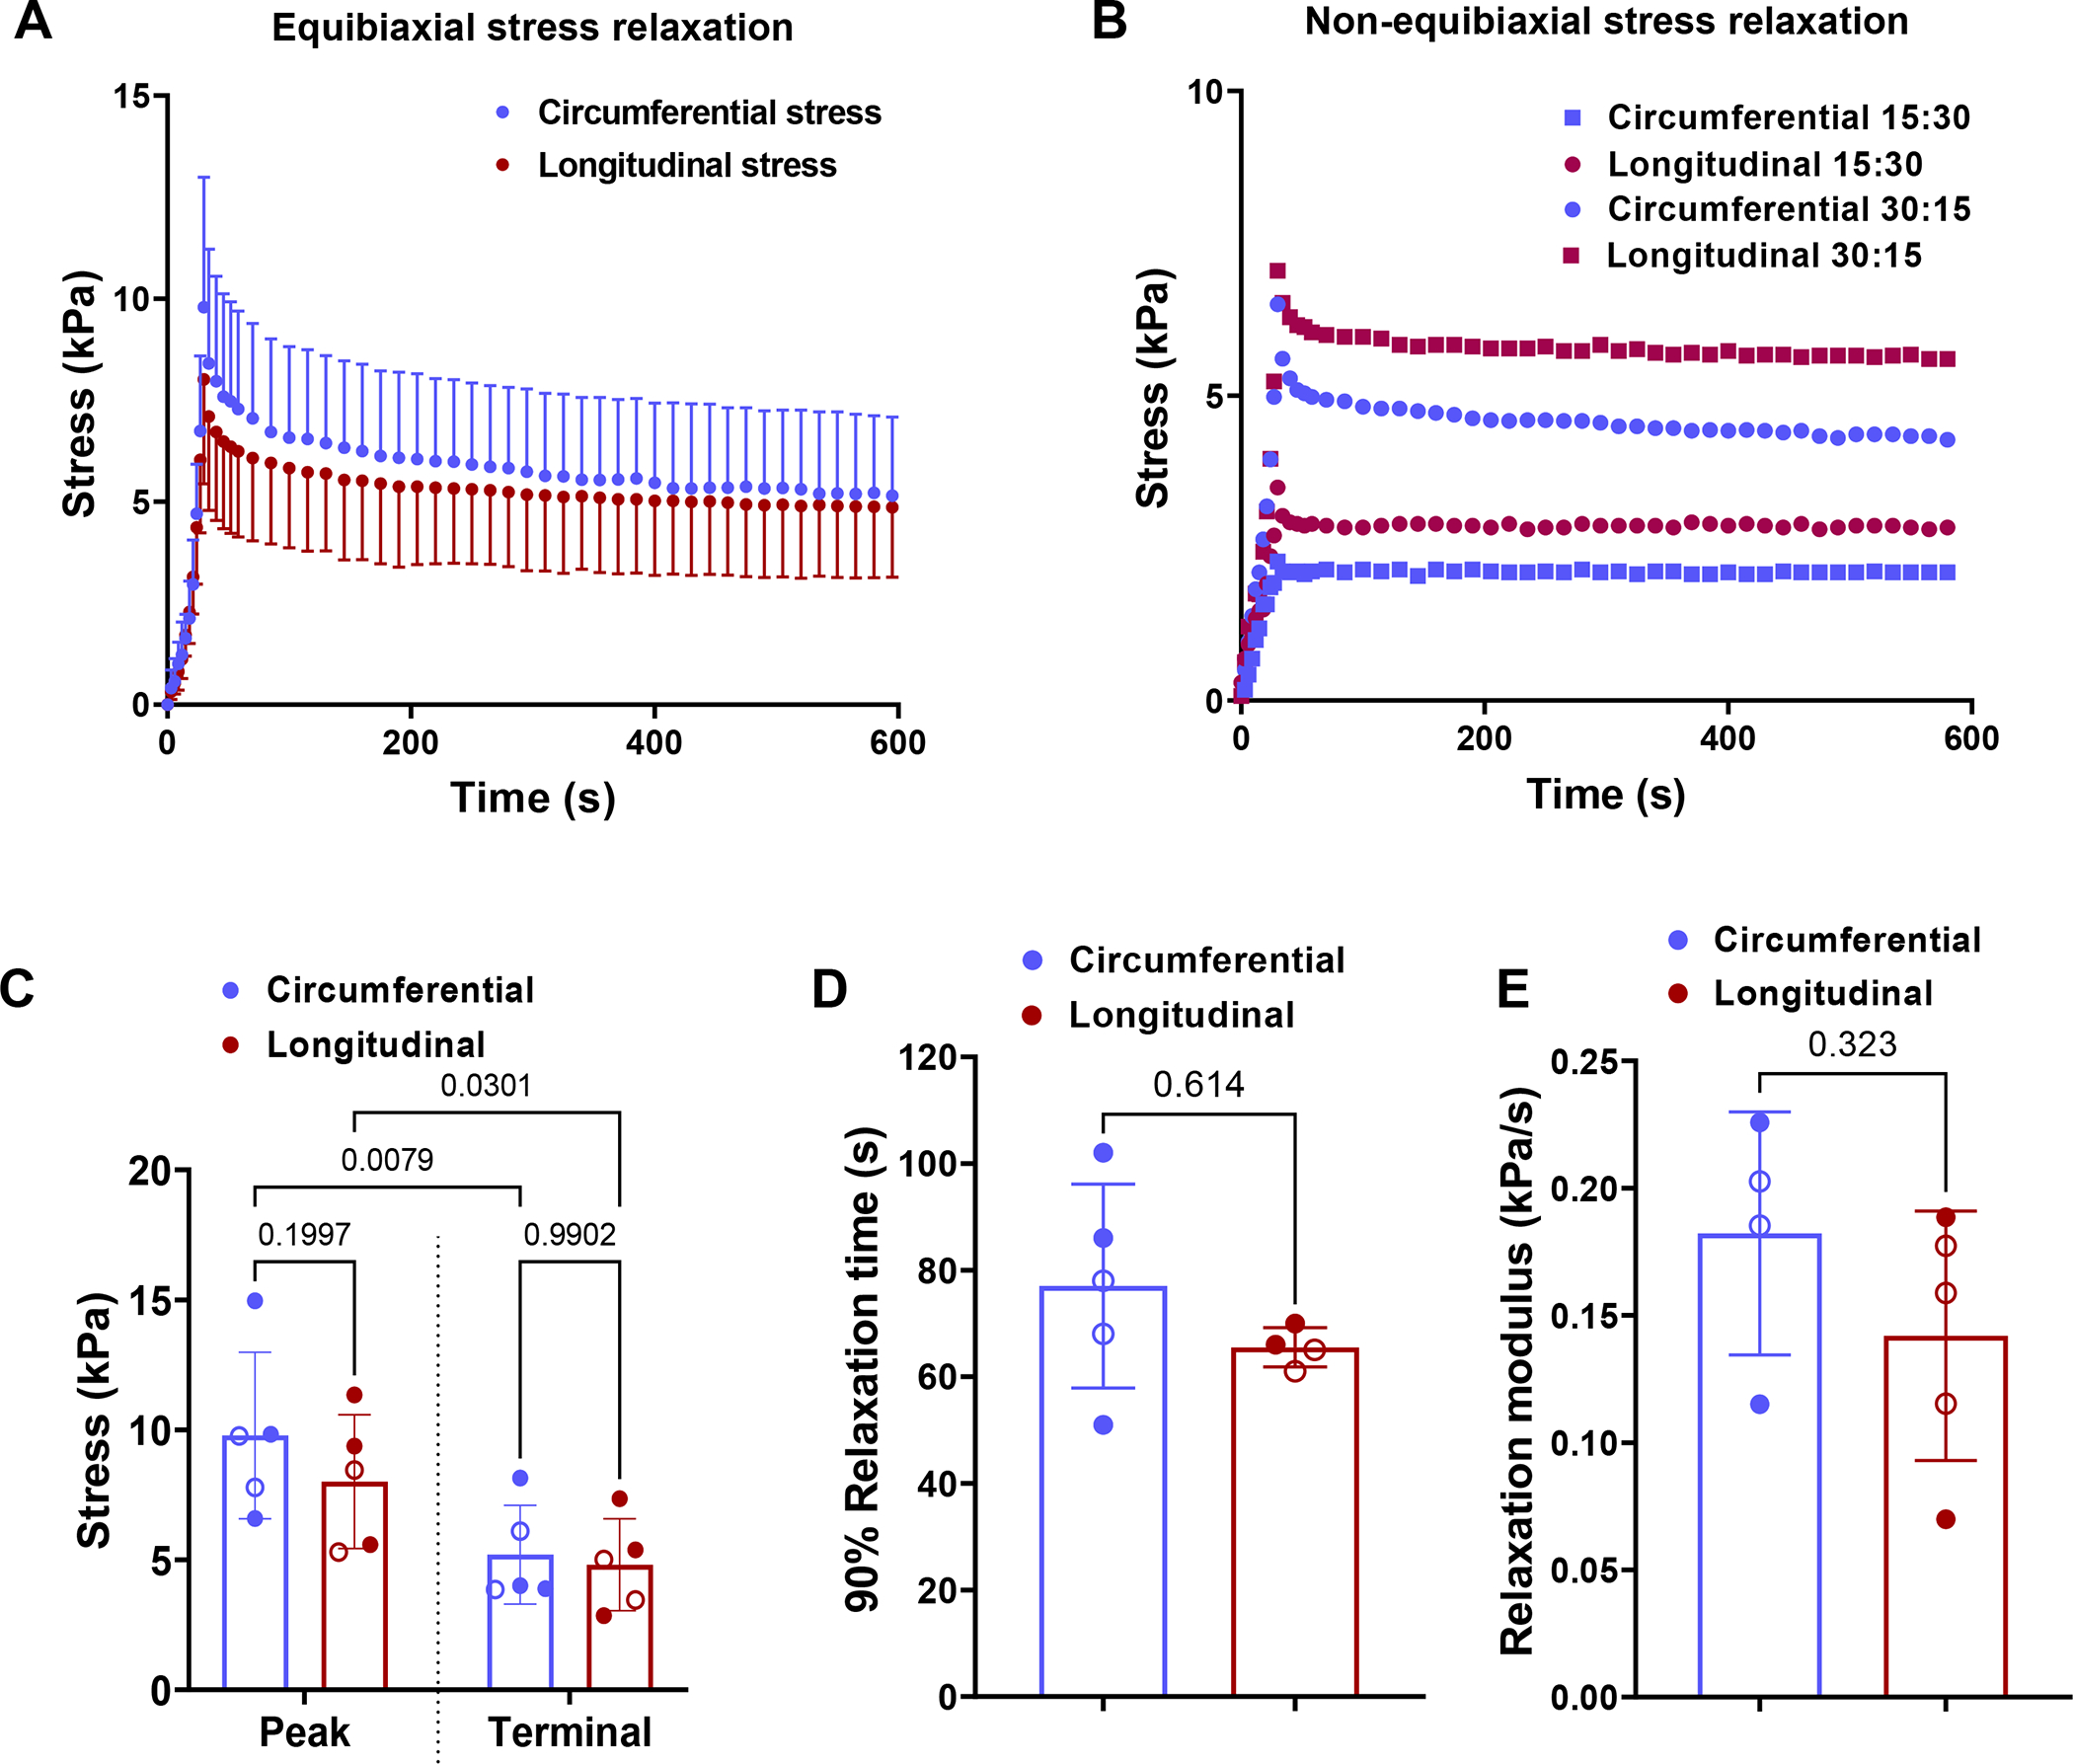
Fig. 5.

(A) Equibiaxial stress relaxation curves. (B) Non-equibiaxial stress relaxation curves where the circles denote tests where circumferential:longitudinal stretch is 30%:15% while the squares denote the test where the stretch ratios are the reverse. (C) Mean peak and terminal stress values. Terminal stress is measured at t = 600 s. (D) Relaxation time and (E) relaxation modulus calculated as the slope of the stress-time curve at the start of relaxation. Two-way ANOVA with repeated measures was used to perform statistical analysis in (C). Paired t-tests were performed to determine the statistical significance between the circumferential and longitudinal directions in (D) and (E). Stress calculated is 1st-PK stress. The filled and hollow markers indicate male and female specimens, respectively.
