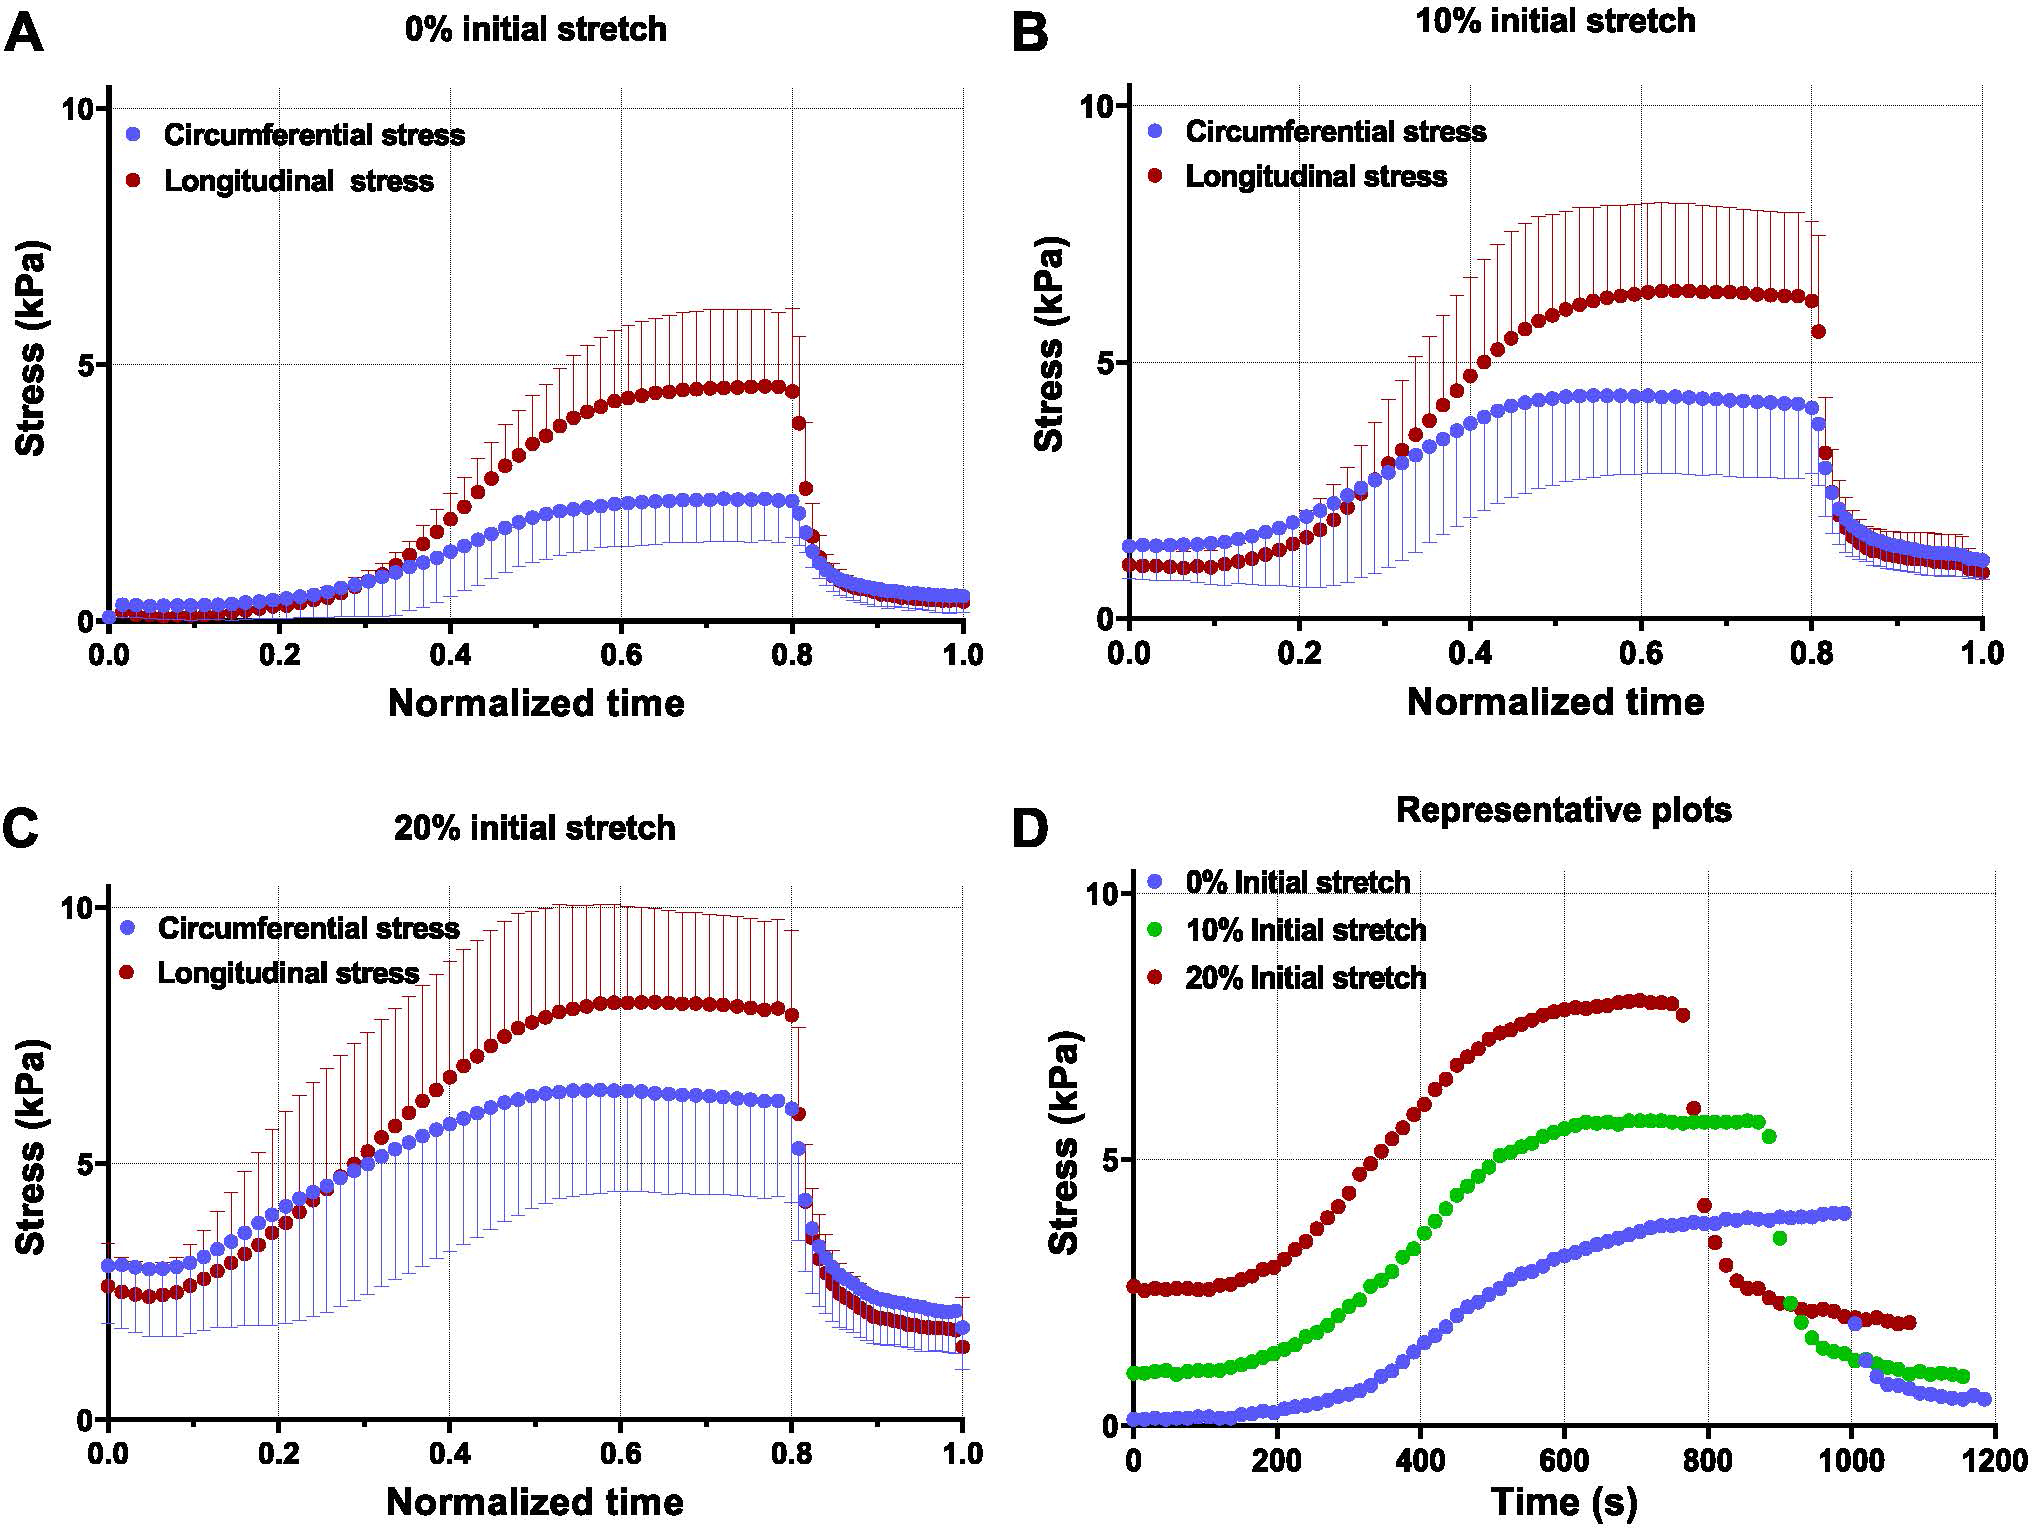
Fig. 6.

Active contractile behavior (n = 6) at pre-stretch values of (A) no pre-stretch, (B) 10% pre-stretch, (C) 20% pre-stretch. (D) Representative curves at multiple pre-stretch values indicate the change in the time required to reach peak stress. Specimens with initial stretched were allowed to undergo viscoelastic relaxation before being submerged in Ca2+. Stress calculated is 1st-PK stress.
