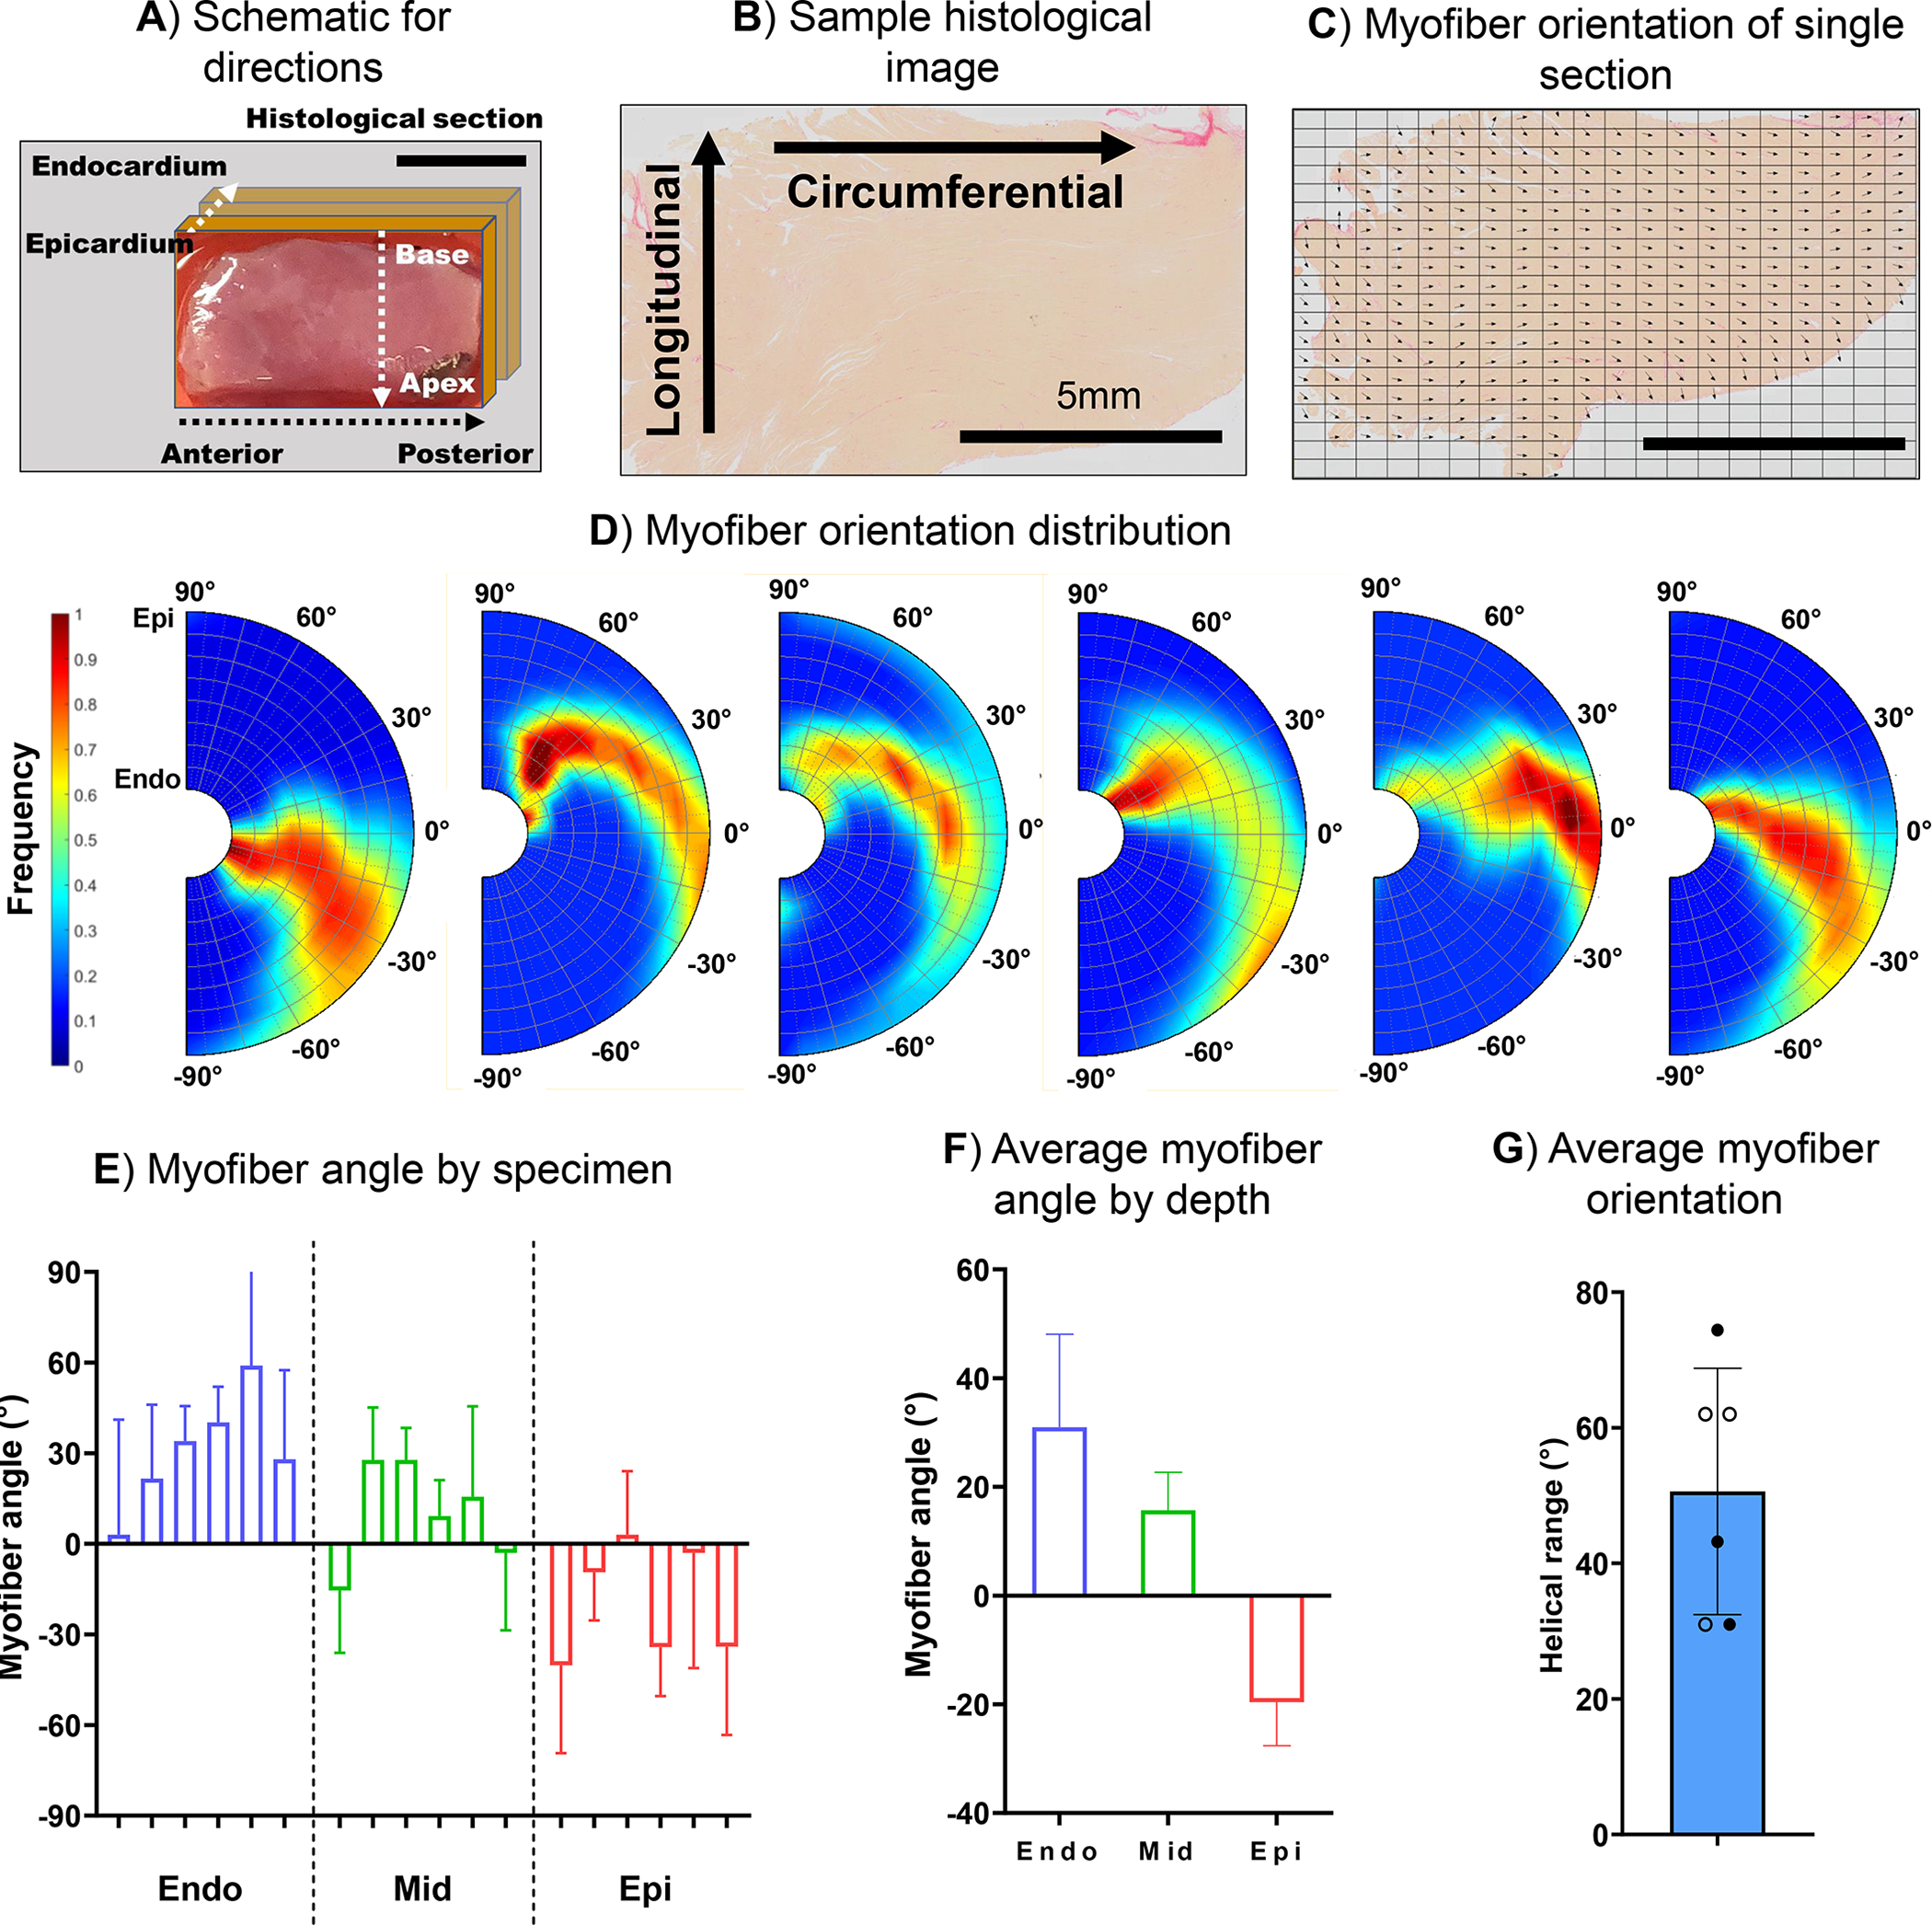
Fig. 9.

(A) Representative schematic of the circumferential (anterior to posterior), longitudinal (apex to base), and transmural directions (epicardium to endocardium). (B) Representative histological slide images of the cardiac tissue stained with picrosirius red (PSR) and (C) the calculated myofiber direction marked with vectors. (D) Transmural myofiber orientations. (E) The average myofiber angle by specimen and by depth (mean and standard deviation obtained from Beta distribution), (F) the average myofiber angle by depth-averaged over the six specimens, and (G) the helical range (the angle of rotation of the fibers from the endocardium to the epicardium). The filled and hollow markers indicate male and female specimens, respectively. Scale bar in (A), (B), and (C): 5mm.
