. 2023 Jun 12;83(16):2675–2689. doi: 10.1158/0008-5472.CAN-22-3645

Figure 2.

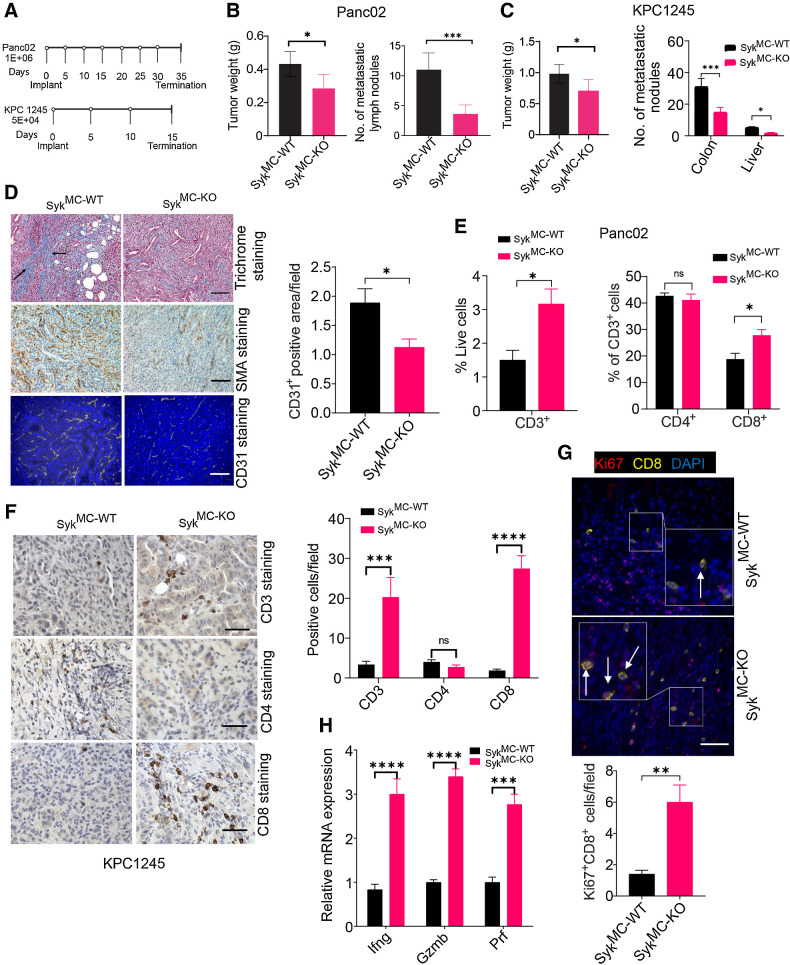
Figure 2. Macrophage Syk regulates immunosuppression, PDAC growth, and metastasis. A, Panc02 and KPC1245 tumors were orthotopically implanted into SykMC-WT and SykMC-KO mice according to the depicted schema. B and C, Left, weights of pancreata containing Panc02 (B) or KPC1245 (C) tumors from SykMC-WT and SykMC-KO mice. Right panels of B and C show quantification of metastatic nodules in colonic lymph nodes and liver. Significance testing was performed by nonparametric t tests. D, Left, representative images showing trichrome, αSMA, and CD31 staining in KPC1245 PDAC tumors. Scale bar, 50 μm. Right, CD31 quantification. E, FACS quantification of CD3+, CD4+, and CD8+ T cells in Panc02 PDAC tumors. F, Left, IHC of KPC1245-PDAC tumors for CD3, CD4+, and CD8. Scale bar, 20 μm. Right, immunodetection of T cells/microscopic field (n = 3). G, Top, IF staining of CD8 (yellow), DAPI (blue), and Ki67 (red) in KPC1245-PDAC tumors. Bottom, quantification data. Scale bar, 10 μm. H, mRNA expression of Ifng, Gzm, and Prf in orthotopic SykMC-WT and SykMC-KO Panc02 tumors. Statistical significance was determined using the Student t test or one-way ANOVA with Tukey post hoc multiple pairwise testing when analyzing more than two groups. *, P < 0.05; **, P < 0.01; ***, P < 0.001; ****, P < 0.0001; ns, not significant.

Macrophage Syk regulates immunosuppression, PDAC growth, and metastasis. A, Panc02 and KPC1245 tumors were orthotopically implanted into SykMC-WT and SykMC-KO mice according to the depicted schema. B and C, Left, weights of pancreata containing Panc02 (B) or KPC1245 (C) tumors from SykMC-WT and SykMC-KO mice. Right panels of B and C show quantification of metastatic nodules in colonic lymph nodes and liver. Significance testing was performed by nonparametric t tests. D, Left, representative images showing trichrome, αSMA, and CD31 staining in KPC1245 PDAC tumors. Scale bar, 50 μm. Right, CD31 quantification. E, FACS quantification of CD3+, CD4+, and CD8+ T cells in Panc02 PDAC tumors. F, Left, IHC of KPC1245-PDAC tumors for CD3, CD4+, and CD8. Scale bar, 20 μm. Right, immunodetection of T cells/microscopic field (n = 3). G, Top, IF staining of CD8 (yellow), DAPI (blue), and Ki67 (red) in KPC1245-PDAC tumors. Bottom, quantification data. Scale bar, 10 μm. H, mRNA expression of Ifng, Gzm, and Prf in orthotopic SykMC-WT and SykMC-KO Panc02 tumors. Statistical significance was determined using the Student t test or one-way ANOVA with Tukey post hoc multiple pairwise testing when analyzing more than two groups. *, P < 0.05; **, P < 0.01; ***, P < 0.001; ****, P < 0.0001; ns, not significant.