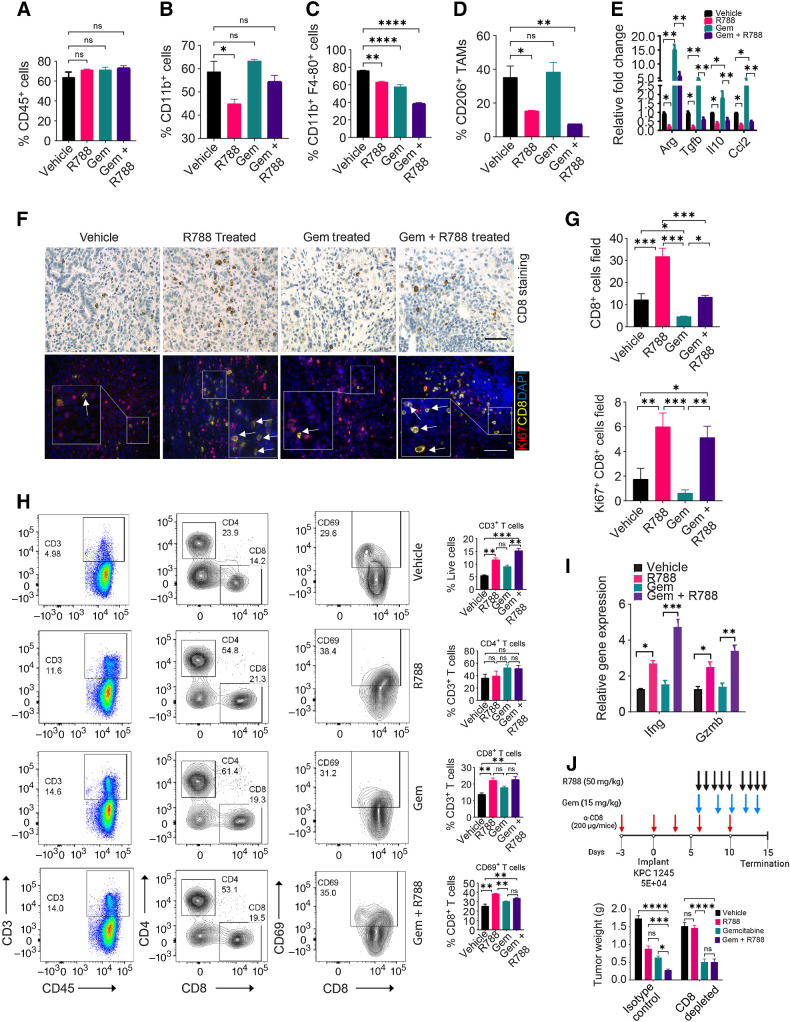
Figure 5.
R788 overcomes Gem-induced immunosuppression and increases cytotoxic T cells in PDAC. A–D, FACS quantification of intratumoral CD45+ cells (A), CD11b+ cells (B), CD11b+Gr1−F4/80+ TAMs (C), and CD206+ TAMs (D) in end-stage KPC1245 tumors (n = 4) from Fig. 4C. E, Relative mRNA expression data of immunosuppressive genes in KPC1245 tumors from Fig. 4C (n = 3). F, IHC of KPC1245 PDAC tumors for CD8 (scale bar, 20 μm; top) and IF staining of CD8 (yellow) and Ki67 (red) in KPC1245-PDAC tumors (bottom). G, Quantification of CD8+ cells/40× (n = 3; top) and quantification of Ki67+CD8+ cells/40× (bottom) in tissue sections. Scale bar, 20 μm H. FACS plots (right) and quantification (left) of CD3+, CD4+ CD8+ T cells, CD44+CD62L−, CD69+ T cells in KPC1245 PDAC. I, Relative mRNA expression of Ifnγ and Gzmb in KPC1245 tumors (n = 3). J, Top, schema showing administration of different drugs together with anti-CD8 depleting antibodies. Bottom, weight of pancreata containing KPC1245 tumors. Significance testing was performed by one-way ANOVA with Tukey post hoc multiple pairwise testing. *, P < 0.05; **, P < 0.01; ***, P < 0.001; ****, P < 0.0001; ns, not significant.

