Figure 5.
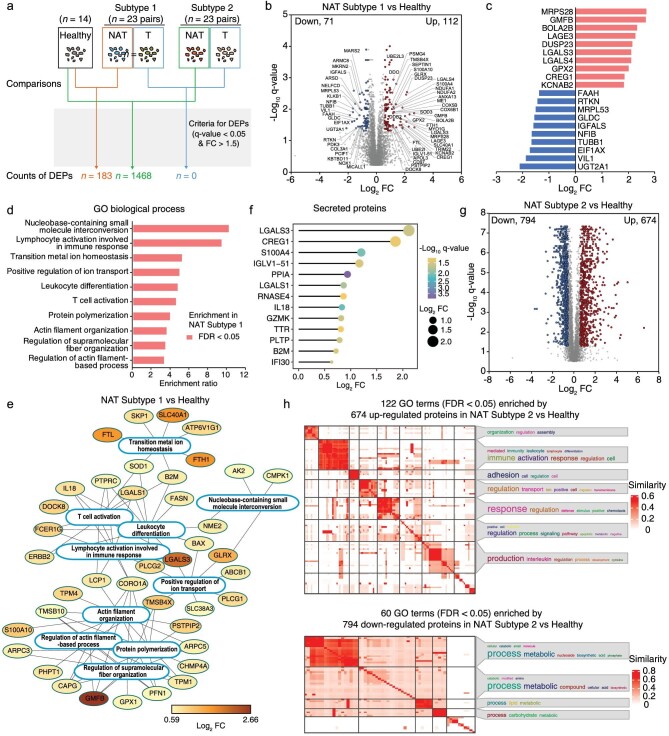
The proteomic differences of two NAT subtypes compared to healthy liver. a. Differently expressed proteins between healthy liver tissues and Subtype 1 NATs, between healthy liver tissues and Subtype 2 NATs, between paired tumors of two NAT subtypes, were calculated using the criteria of FC > 1.5 and q-value < 0.05. b. The volcano plot showed the differently expressed proteins between healthy liver tissues and Subtype 1 NATs. The x-axis represented log2 transformed fold changes of Subtype 1 NATs to healthy liver tissues. The y-axis represented negative log10 transformed q-value. c. The barplot showed the top ten upregulated proteins and the top ten downregulated proteins. The x-axis represented log2 transformed fold changes of Subtype 1 NATs to healthy liver tissues. d. The significantly enriched biological processes of the upregulated proteins in Subtype 1 NATs compared to healthy liver tissues. The 5170 proteins quantified in more than half of the samples by DIA were input as the background reference list in enrichment analysis. e. The significantly enriched GO biological processes (FDR < 0.05) of the upregulated proteins in Subtype 1 NATs compared to healthy liver tissues. The protein-protein interaction information was extracted from the STRING database. f. The dotplot showed the thirteen upregulated proteins which were annotated as secreted proteins. The negative log10 transformed q-values were represented by different colors. The log2 transformed fold changes were represented by different circle sizes. g. The volcano plot showed the differently expressed proteins between healthy liver tissues and Subtype 2 NATs. The x-axis represented log2 transformed fold changes of Subtype 2 NATs to healthy liver tissues. The y-axis represented negative log10 transformed q-value. h. The significantly enriched GO terms (FDR < 0.05) in 674 upregulated and 794 downregulated proteins in Subtype 2 NATs compared to healthy livers were displayed by the binary cut method for clustering similarity matrices of functional terms.

