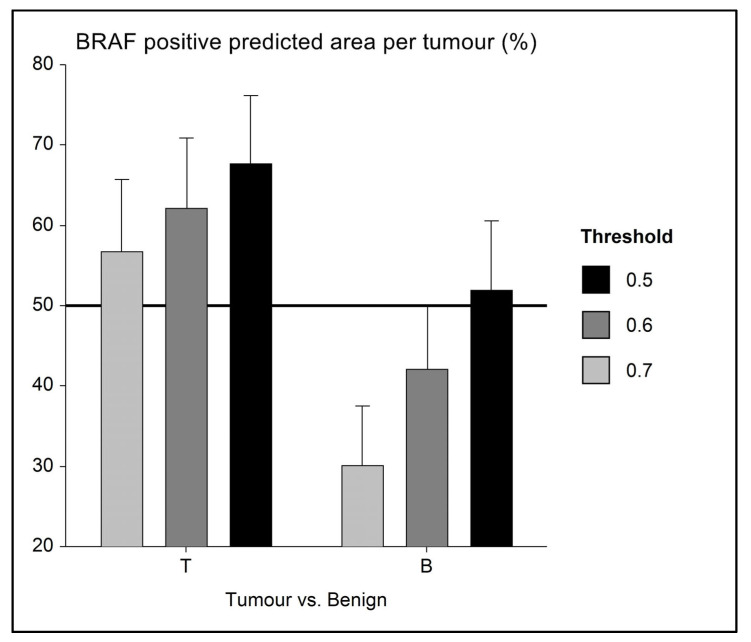
Figure 4.
Error bar chart with columns representing mean group values and an indication of the standard error of the mean (SEM). In a small series (n = 14) of BRAF-mutated UC with adjacent benign urothelium, the level of mutation prediction (indicated as a percentage of BRAF positive labelling) differs, and AI is able to distinguish between tumour (BRAF positive) and benign (presumably BRAF negative) tissue. As a mean, benign tissue is correctly labelled as mutation negative (i.e., <50% BRAF positive) when using 0.6 and 0.7 AI threshold classifiers.

