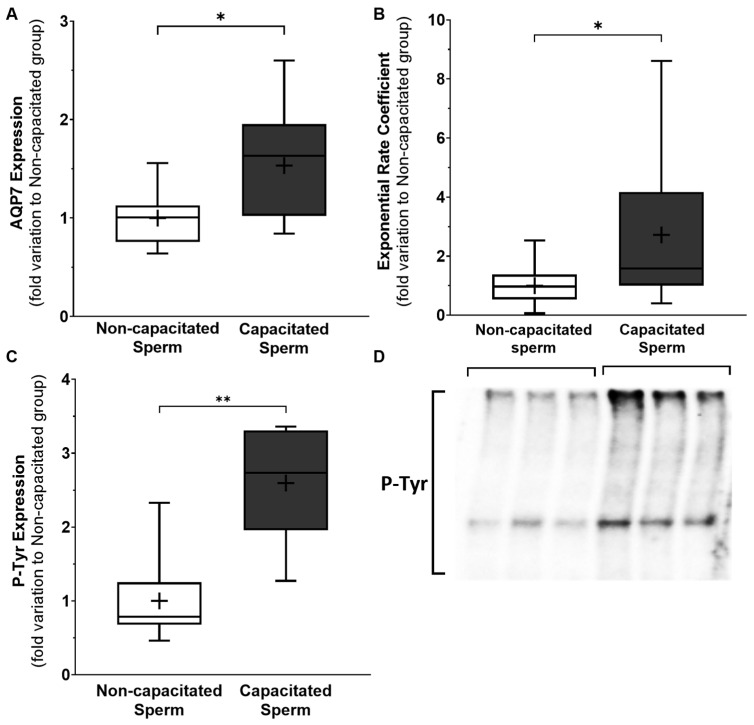
Figure 4.
Protein expression levels of AQP7 (A), membrane glycerol permeability (exponential rate coefficient) (B), level of tyrosine phosphorylation (p-Tyr) (C), and representative blot (D) of non-capacitated sperm versus capacitated sperm. Results presented in min. to max. graphs, with a cross representing the mean of the sample size. Significantly different results with p < 0.05 are indicated as: *; p < 0.01 are indicated as: **. n = 12.

