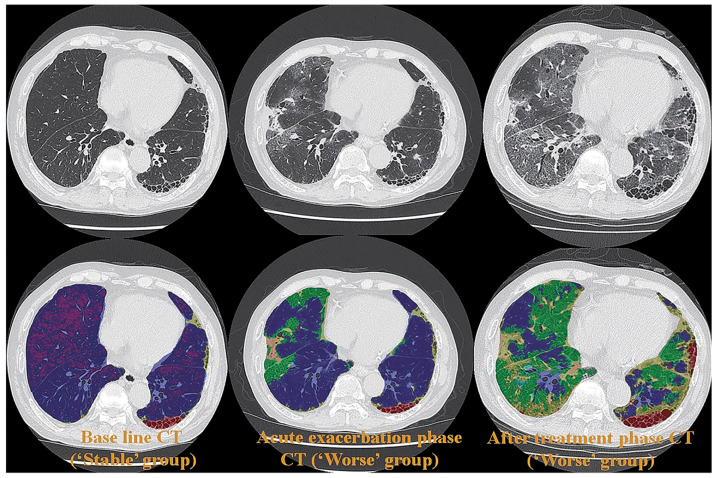
Figure 2.
A 65-year-old female patient with progressive scleroderma (top row, L to R: thin-section CT scans at baseline, acute exacerbation phase, and after-treatment phase; bottom row, L to R: CT texture analysis by means of machine-learning-based software at baseline and the same two phases as for the top row) (permission from reference [63]). On machine-learning software, normal lung, consolidation, emphysema, GGO, honeycombing and reticulation are expressed as blue, beige, purple, green, red and green. A comparison of CT scans obtained at baseline (i.e., “Stable” group) and at the acute exacerbation phase (i.e., “Worse” group) shows an increase in the GGO and the consolidation area and a decrease in the normal lung area. Δ% normal lung, Δ% GGO, and Δ% consolidation were −16.9%, 13.2%, and 2.5%, respectively, while Δ disease severity score was 6. A comparison of CT scans obtained at the acute exacerbation phase (i.e., “Worse” group) and the after-treatment phase (i.e., “Worse” group) shows an increase in the GGO, reticulation, and honeycomb area and a decrease in the normal lung area. Δ% normal lung, Δ% GGO, Δ% reticulation, and Δ% honeycomb were −19.5%, 14.9%, 4.2%, and 0.2%, while Δ disease severity score was 15. CT, computed tomography; GGO, ground-glass opacity.

