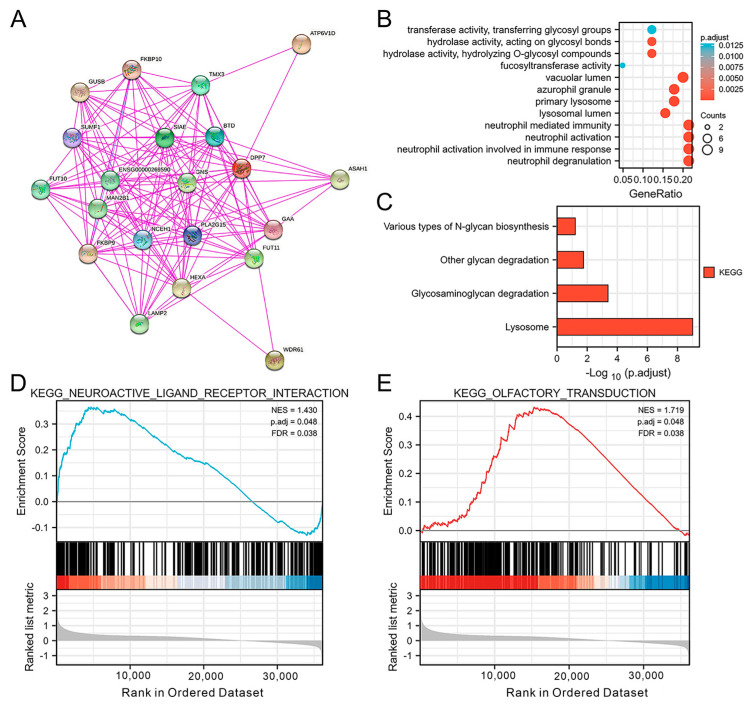
Figure 6.
DPP7-associated protein–protein interaction network and pathway enrichment analysis. (A) GO enrichment plot of DPP7 in the CRC (B) KEGG pathway analysis based on DPP7 expression in the CRC (C) GSEA results, in turn based on the differentially expressed genes in high-DPP7-expression and low-DPP7-expression samples, identified significantly enriched pathways involving neuroactive ligand–receptor interaction (D) and olfactory transduction signaling (E). The count indicates the number of genes related to the enriched GO pathway. The color of the bar denotes the −log10 (p.adjust). NES, normalized enrichment score; FDR, false discovery rate.

