Figure 4.
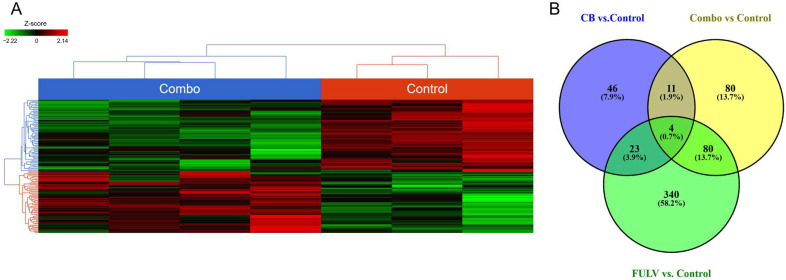
Combination and control tumors present different gene expression patterns. (A) Heat map for untreated control vs. combination treatment was generated using FDR <0.05 and fold change >2. (B) Venn diagram depicting the number of common and unique genes in the various treatment arms; monotherapy and combination therapies (compared to the untreated control). Analysis adjusted for multiple comparisons using a FDR <0.05 and fold change >2.

