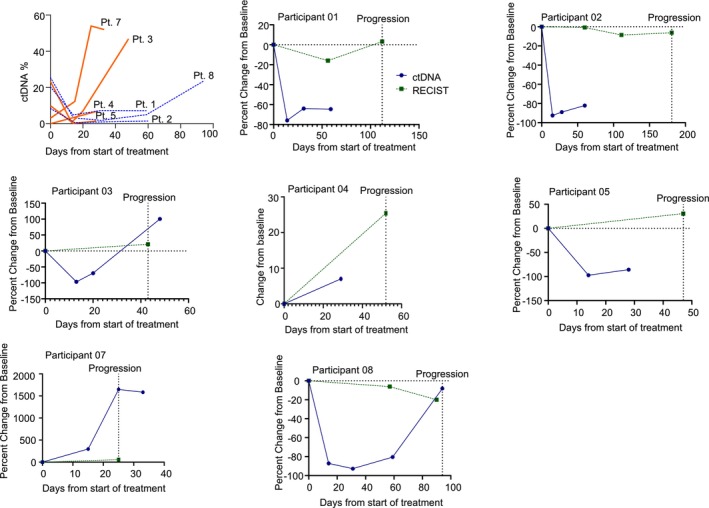
FIGURE 4.

Circulating tumor DNA and RECIST measurements for all patients with detectable ctDNA. (A) Absolute ctDNA levels over time for all participants with detectable ctDNA. Patients with best response as progressive disease have orange solid lines and patients with best response as stable disease have a blue dashed lines. (B–H) are individual patient ctDNA and RESIST measurements. In green dashed is RECIST percent change from baseline and in blue solid is percent change in ctDNA from baseline. For participant 4 (E), ctDNA was not detectable at baseline so we show absolute change from baseline in %ctDNA and relative change from baseline for RECIST.
