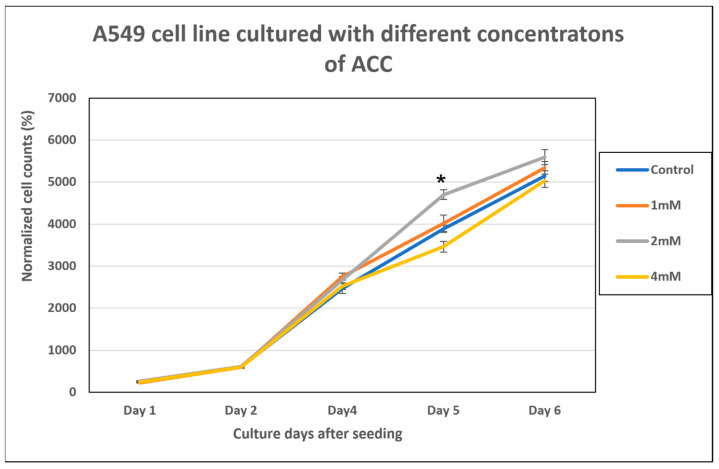
Figure 4.
Cell counts of A549 cells cultured with 1, 2, and 4 mM elemental calcium in ACC suspensions, compared to the control (regular DMEM-F12 medium). The graph is presented as the normalized percentages, compared to seeding day, which constitutes 100%. Data are presented as mean ± SEM. * This is a statistically significant result relative to the control and other groups (p < 0.05).

