
FIGURE 2.
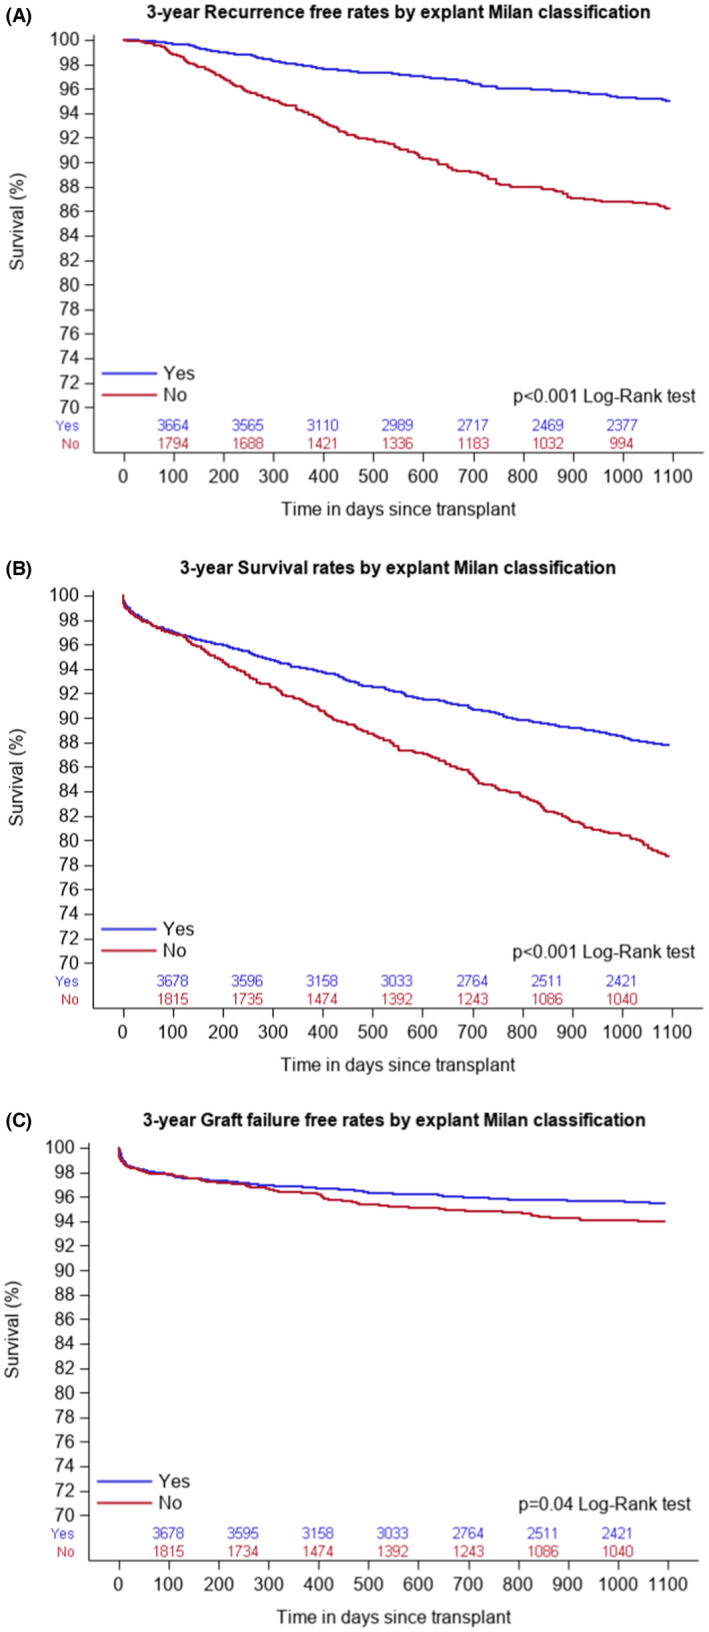
(A) Showing Kaplan–Meier curve for 3‐year recurrence by explant histopathology. (B) Showing Kaplan–Meier curve for 3‐year mortality by explant histopathology. (C) Showing Kaplan–Meier curve for 3‐year graft failure by explant histopathology.