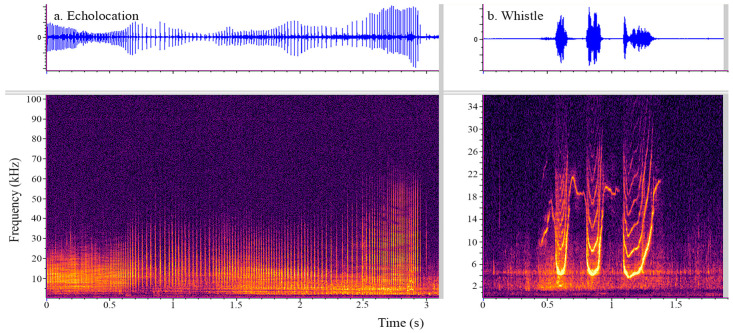
Figure 1.
Spectrogram of low frequency clicks (a) and a whistle (b) produced by a bottlenose dolphi. Frequency (x-axis) is given in kHz, and time is presented in s (y-axis). The energy is given in a color gradation with lighter colors representing higher energy sound. The corresponding waveform (relative amplitude on the y-axis and time (s) on the x-axis) is plotted above the examples of echolocation clicks (panel (a)) and a whistle (panel (b)). Clicks appear as broadband vertical lines with little to no visible space (inter-click interval) between consecutive lines (clicks). The whistle can take many different shapes but appears as a bright narrow line that changes in frequency over time and can have harmonics (repetitive lines at interval frequencies above the lowest fundamental frequency contour).

