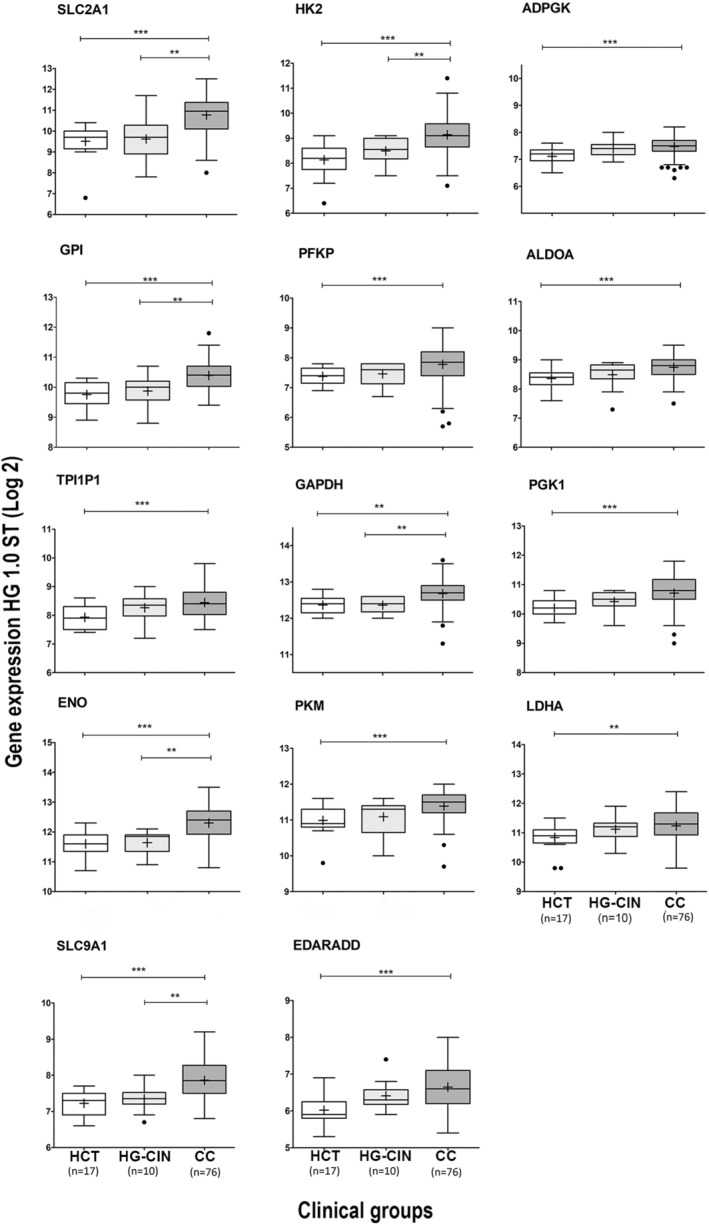
FIGURE 1.

Box plots of the expression of 14 genes of the glycolytic pathway obtained with the HG‐1.0 ST microarray. The analysis was performed on 17 HCT, 10 HG‐CIN, and 76 CC samples. The graphs show the value of the normalized fluorescence intensity (log 2) for each gene. The upper and lower limits of the boxes represent the 75th and 25th percentiles, respectively. The mean is shown as the center black line inside the boxes, and the median is shown as “+”. The whiskers represent the maximum and minimum values that lie within 1.5 times the interquartile range from the ends of the frame. Values outside this range are displayed as black dots. The Mann–Whitney U test was used to determine the significant differences between the groups, **p < 0.05, ***p < 0.005. CC, cervical cancer; HCT, healthy cervical tissue; HG‐CIN, high‐grade cervical intraepithelial neoplasm.
