FIGURE 2.

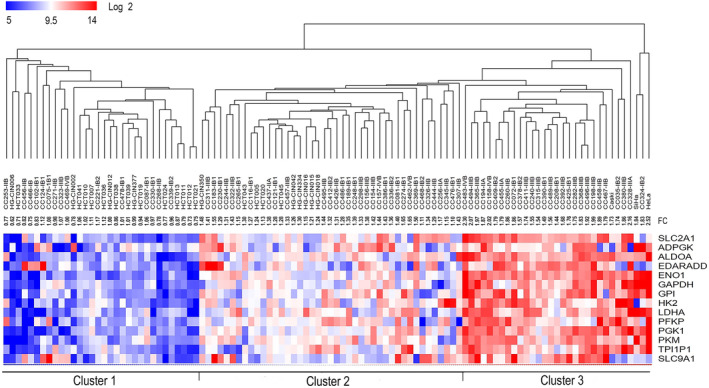
Unsupervised hierarchical cluster analysis of 14 glycolytic genes in CC. The segregation of HCT (n = 17), HG‐CIN (n = 10), and CC (n = 76) samples is shown according to the expression profile of 14 glycolytic genes. Three clusters were distinguished: the first cluster had a downregulated glycolysis profile, the second had an intermediate expression glycolysis profile, and the third cluster had an upregulated glycolysis profile. The intensity of gene expression was coded as follows: red for upregulation, blue for downregulation, and white for no change in expression. Each column represents a sample, and each line represents a glycolytic gene. The number at the end of the CC sample name indicates the FIGO stages of the patient. The analysis was performed with the expression values expressed in base 2 logarithmic. The glycolysis FC score was indicated for each sample (FC). CC, cervical cancer; HCT, healthy cervical tissue; HG‐CIN, high‐grade cervical intraepithelial neoplasm.
