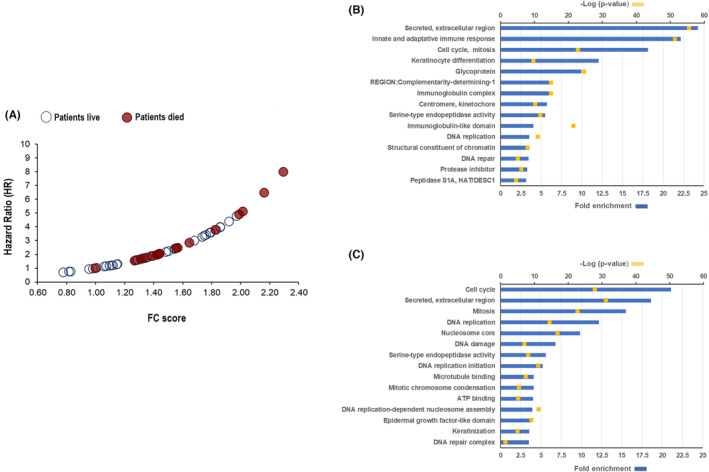
FIGURE 3.

Hazard ratio (HR) analysis and identification of biological processes enriched in CC according to the glycolysis fold change (FC) score. Panel (A) shows the hazard ratio (HR) analysis in relation to the glycolysis FC score obtained with the data of the HG‐1.0 ST microarray. The risk of death from CC increases exponentially as glycolytic gene expression increases. Red circles represent dead patients, while light circles represent surviving patients. Panels (B and C) show the top 15 canonical pathways enriched in CC with glycolysis FC scores <1.42 (n = 30) and ≥1.42 (n = 31), respectively. Fold enrichment (blue bars) and p values (yellow squares) were obtained with the DAVID functional annotation tool (see Materials and Methods).
