
FIGURE 4.
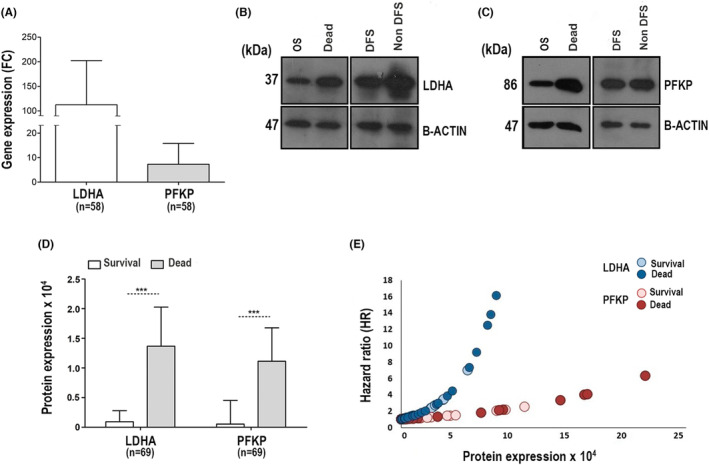
Validation of LDHA and PFKP expression in CC. The expression of LDHA and PFKP in CC was validated at the mRNA and protein levels by qRT–PCR and WB, respectively. Panel A shows the qRT–PCR analysis of LDHA and PFKP mRNA in 58 CCs. The expression was normalized with respect to the internal control (RPS13) and the control group by the double delta method using the final formula (2−ΔΔCT). Panels B and C show representative images of WB of LDHA and PFKP expression, respectively. OS = overall survival, DFS = disease‐free survival, non‐DFS = patients who died or surviving with the disease. The molecular weight of the proteins is shown in kilodaltons (kDa). The protein β‐actin was used as an internal control. All samples were derived from the same experiment, and gels and blots were processed in parallel. Panel D shows the mean expression ± SD of LDHA and PFKP proteins between patients with CC who survived (white bars, n = 47) and those who died (gray bars, n = 22). The intensity of LDHA and PFKP was normalized with respect to β‐actin. The expression is shown as optical density (OD) units. The significant differences between the groups were calculated with the Mann–Whitney U test, and p < 0.05 was considered statistically significant. Panel E shows the hazard ratio (HR) analysis in relation to LDHA and PFKP protein expression in CC. The risk of death from CC increases exponentially as protein expression (OD) increases, but it is more evident with the expression of LDHA (dark blue circles represent dead patients, while light blue circles represent surviving patients) than PFKP (dark red circles represent dead patients, while light red circles represent surviving patients). SD = standard deviation.