
FIGURE 5.
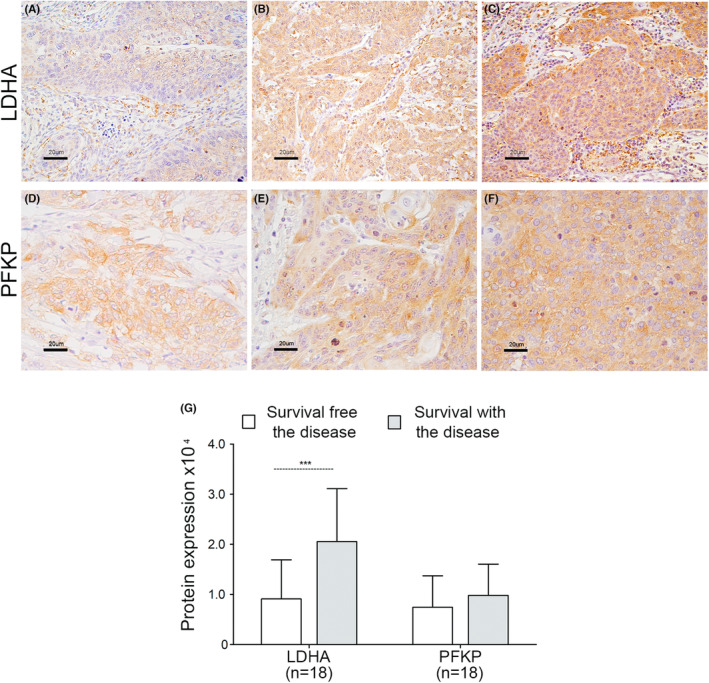
Expression of LDHA and PFKP proteins according to IHC. The expression of the LDHA and PFKP proteins was determined by IHC. Histological analysis included 18 CC and 6 metastatic tissues. A representative image of the experiments is shown. The detection of LDHA protein (panels A–C) and PFKP protein (panels D–F) was performed with specific antibodies. Panels A and D show the detection of LDHA and PFKP, respectively, in CC tissues of patients with DFS. Panels B and E show the expression of LDHA and PFKP, respectively, in CC tissues of patients who surviving with the disease. Panels C and F show the detection of LDHA and PFKP, respectively, in metastatic tissue from patients who surviving with the disease. The specific signal for proteins is shown in brown color and counterstained with hematoxylin in violet color. Original magnification 400x; the bars represent 20 μm. Panel G shows the quantitative analysis of LDHA and PFKP expression in CC tissues of patients with disease‐free survival (n = 8) versus patients who surviving with the disease (n = 10). The average optical density and staining area of LDHA and PFKP (DOI) in the tissues were considered. The mean ± SD of three independent experiments is shown. The Mann–Whitney test was performed to assess the difference between the groups, and p < 0.05 was considered to indicate statistical significance. SD = standard deviation.